$SPY on verge of daily RWB up-trend–window dressing is upon us

GMI6/6
GMI-25/9
T210842%

I am watching for the beginning of a new significant up-trend in the major index ETFs. I define an RWB up-trend using 12 exponential moving averages and the close. A daily RWB up-trend is when the 6 red shorter daily averages are rising above the 6 blue longer daily averages so that there is a white space separating them. The beginning of a daily RWB up-trend starts with the closing price (dotted line) rising above all 12 averages. Next the red lines climb above the blue lines. The chart below has arrows showing the start of four RWB up-trends. It looks like the SPY is beginning an RWB up-trend but there is no visible white separation yet. If the RWB pattern matures, the market is headed higher. During most of an RWB rise, the closing price leads all of the averages higher. A failure of the RWB pattern would occur if the SPY were to close back below all 12 averages and the white separation disappears. We are approaching the end of second quarter and the likely mutual fund window dressing period, so it would not surprise me to see an up-trend develop. The DIA’s pattern looks like the SPY’s but the QQQ is a little further behind. These patterns help me with individual stocks too. It is important to study the market’s behavior, ignore the news and media pundits, and to pull the trigger only after a signal has occurred, not before.


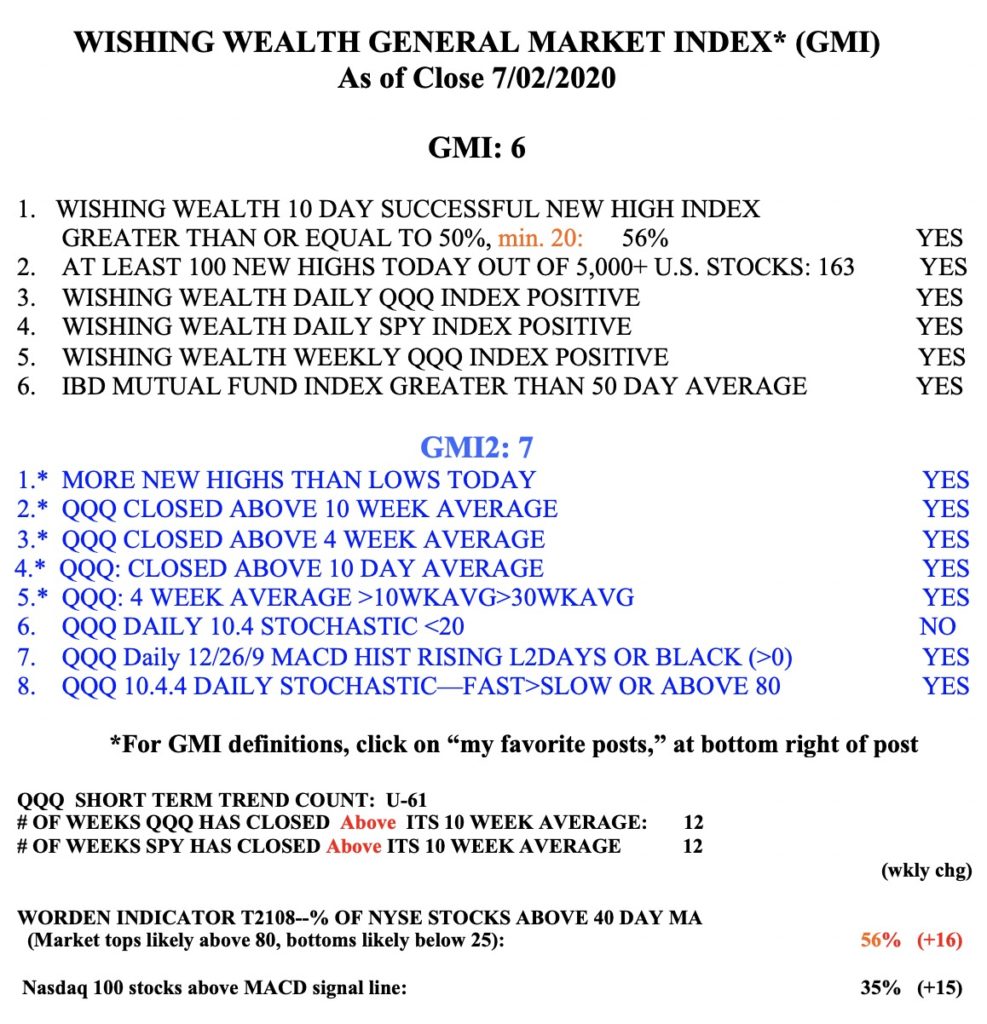
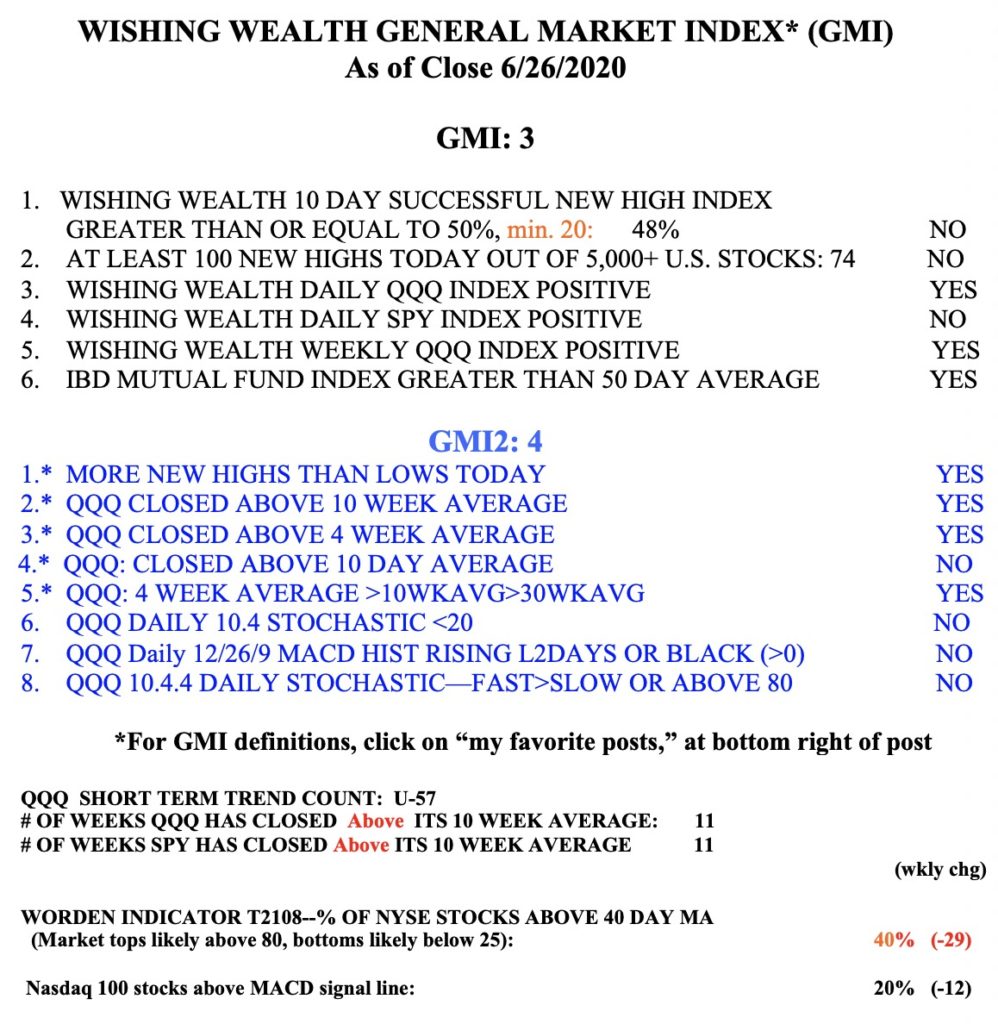
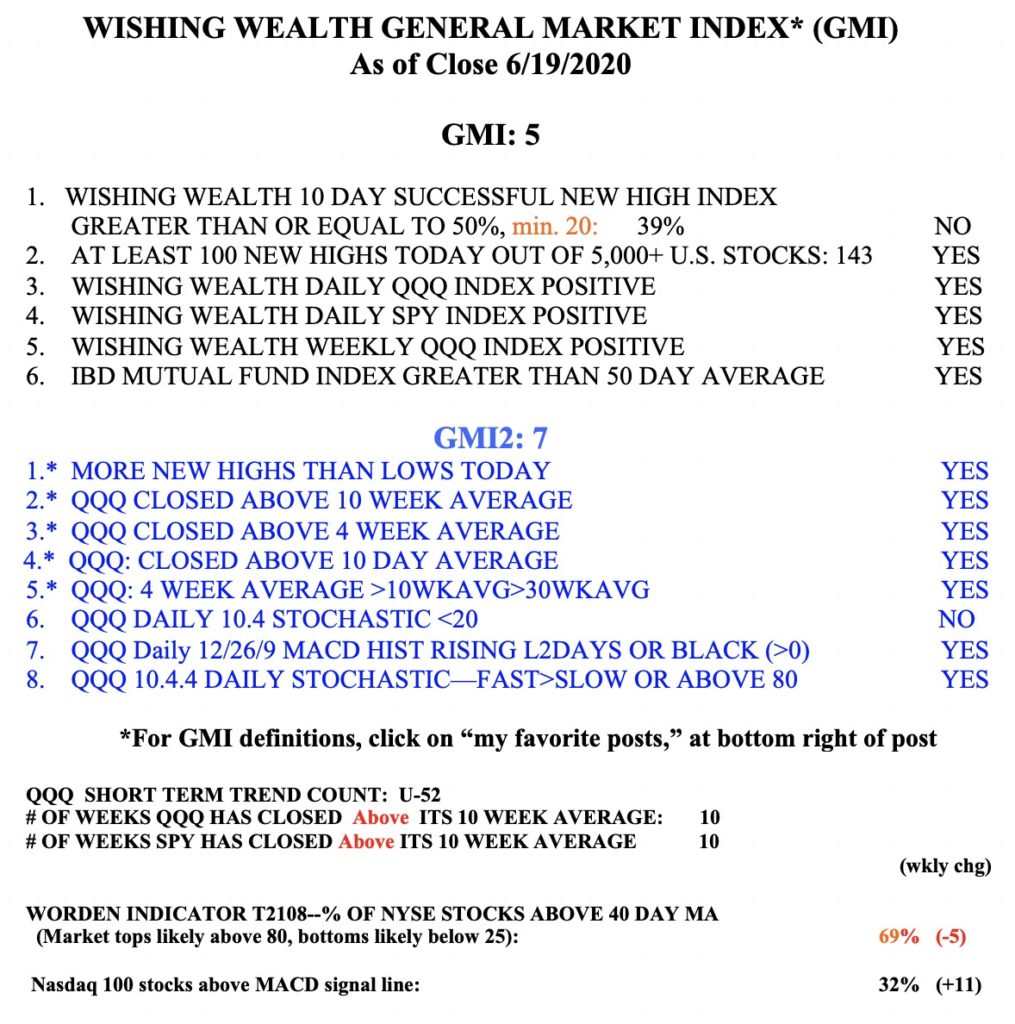
The GMI=6 and Green.

In this market, shorting stocks at new lows is a far better strategy than buying stocks at new highs

GMI1/6
GMI-20/9
T210824%

The general market is in a down-trend. When that happens, the rules for buying stocks on support that worked in the rising market fail miserably. One of the statistics I compute every night after the market has closed is the percentage of all stocks that reached a new high 10 days ago that have now closed above their price price 10 days ago (one of the components in the GMI, see table below). I focus on buying stocks at new highs and therefore want to make sure that stocks that do so are likely to rise. Since May 7, the percentage of about 4900 US stocks that were successful 10 day highs has been 50% or higher on only 5 days (only 30% did so last Friday). During this same period, my opposite, successful 10 day new low indicator, the percentage of stocks that hit a new low 10 days ago and closed lower than they did 10 days earlier has been 50% or more on 16 days,  or all but one day Since May 7. Thus, if I had to trade stocks, I would have had a much better chance of making money if I shorted stocks at new lows or bought put options on them. Buying or holding stocks at or near new highs is now a losers game. Everyone must do some self-analysis to determine why they would do so during a market down-trend. Ask, do I want to make money or to be smart?

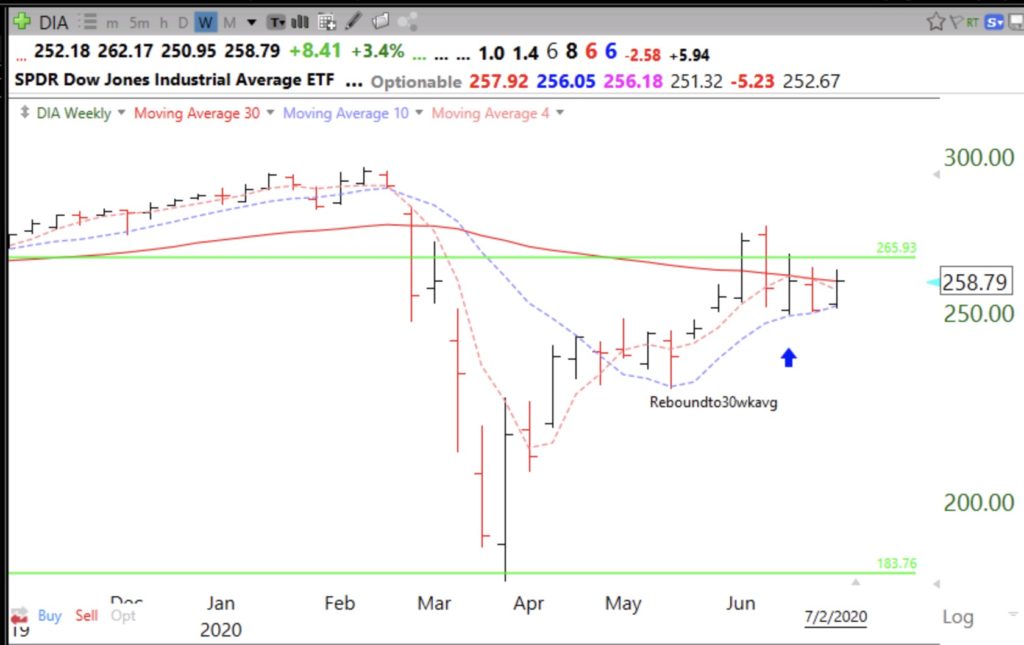
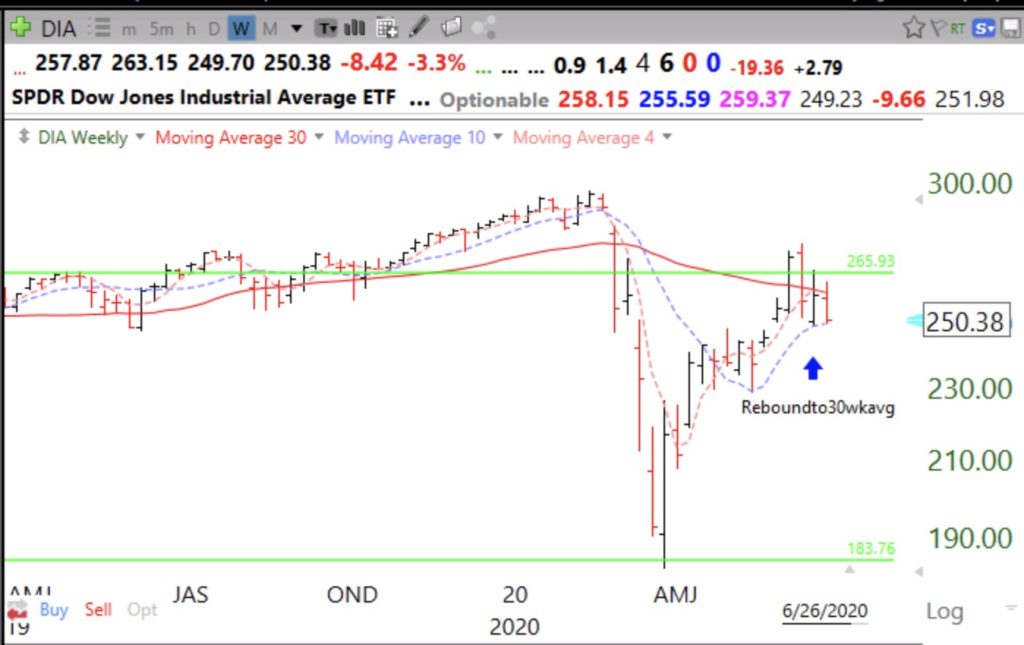
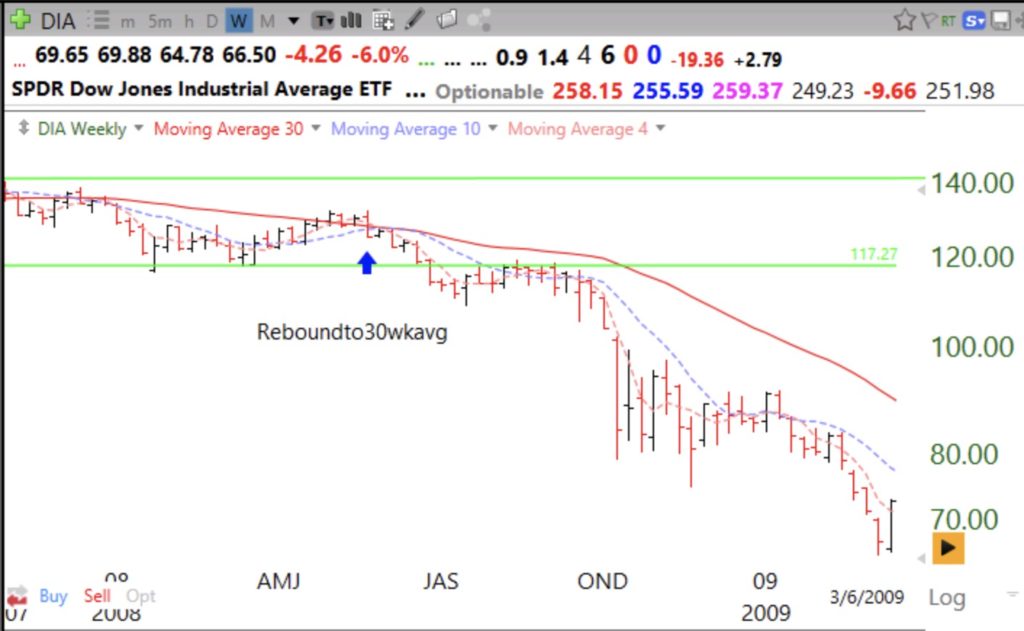
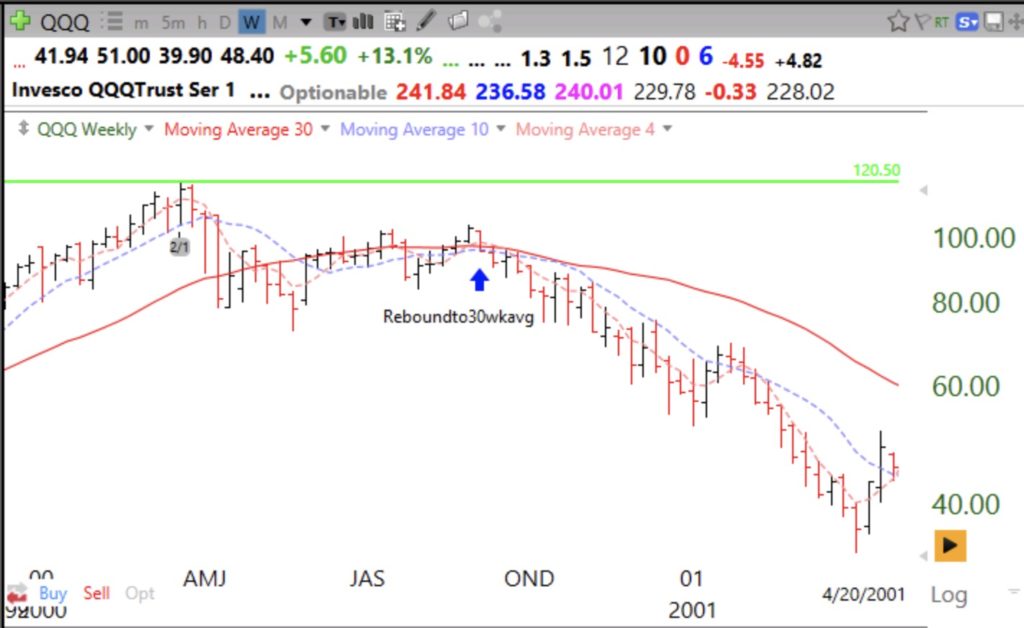
By the way, the Dow (DIA) is now back below its critical 30 week average (solid red line). This may be a triple top formation. If the 30 week average curves down, the market could be at major risk of a significant decline. That signal saved me from staying long during the 2000 and 2008 market debacles.


The GMI remains at 1 (of 6) and on a Red signal. The T2108, currently at 24%, typically falls below 10% at or near a market bottom.