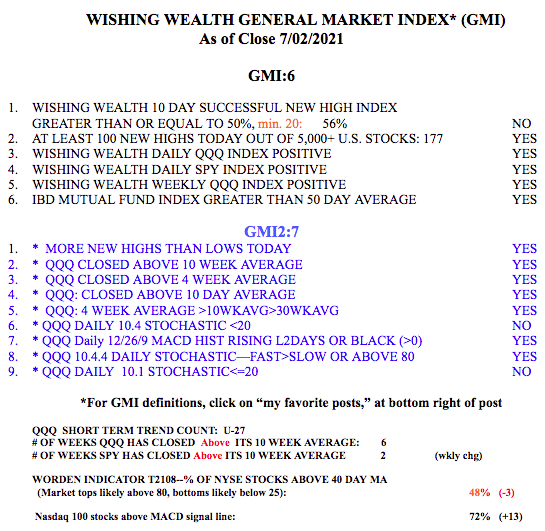
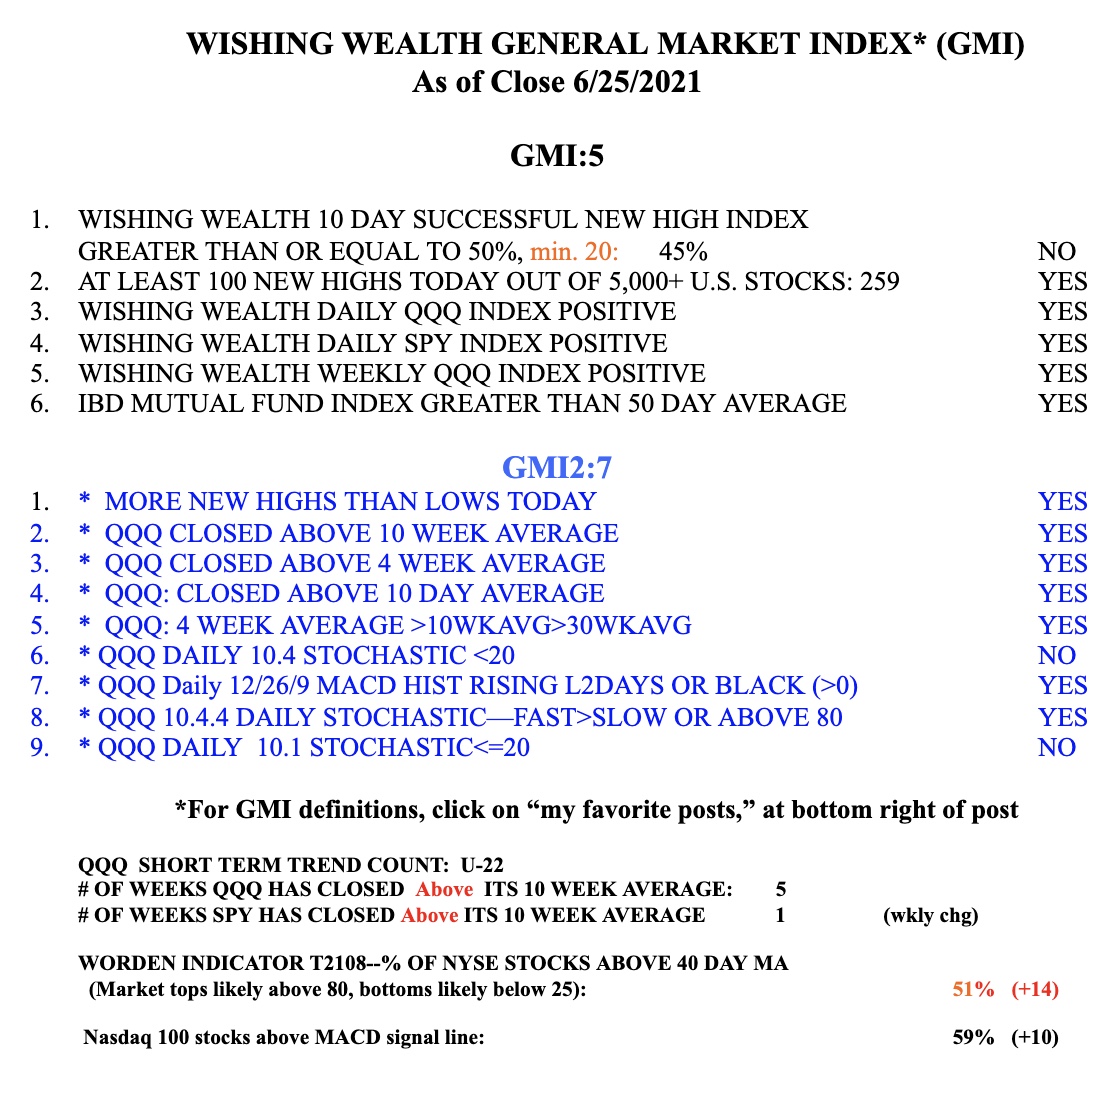
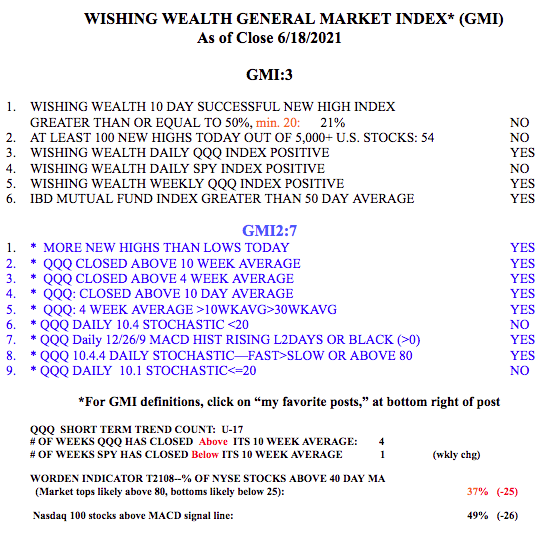
In the GMI table below I provide my QQQ short term trend count. It is currently U-27, indicating the 27th day of the current up-trend which began on 5/26. I try to post in my daily blog the current QQQ short term trend count. I have found that a profitable strategy for me is to make an initial purchase of TQQQ, the 3x leveraged bullish QQQ ETF, on U-1. I then slowly accumulate TQQQ as the trend persists. I have found that this strategy repeatedly beats the performance of holding most individual stocks. Since U-1 on 5/26, TQQQ has advanced +23.3%. During the same period only 4% of the Nasdaq100 stocks, 1% of the S&P500 stocks, none of the Dow 30 stocks, and 6% of all US stocks out performed TQQQ. In other words, holding TQQQ during an up-trend beats more than 94% of individual stocks. Everyone must make a clear choice of their intentions. Are you trying to find the needle in the haystack rare stock that will out perform TQQQ, or are you interested in a higher probability approach to making money? For me, I would rather go with the odds and focus on owning TQQQ. But I must be watching for a change in trend so that I exit TQQQ quickly. TQQQ moves up or down about 3x as much as QQQ………
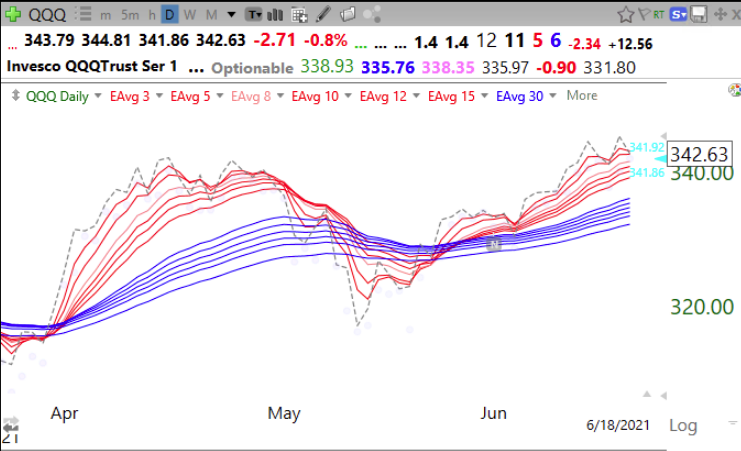
The GMI is heavily weighted towards growth stocks and Nasdaq 100 stocks (QQQ). The GMI is back to 6 (of 6) and keeps me on the right side of the market’s trend. The GMI is flashing a Green signal. It will turn to Red when the GMI registers <3 for 2 consecutive days.