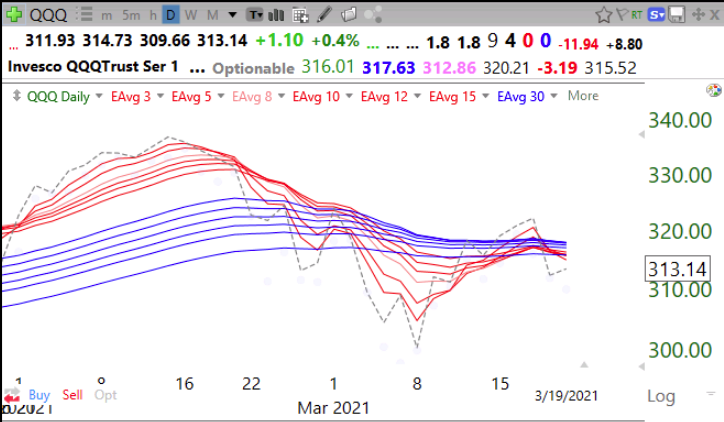
This chart shows that QQQ has fallen back below all 12 daily moving averages. Could form a daily BWR down-trend. The pundits are talking about rotation from tech to value stocks. But in my experience, tech has always led. It could be we are seeing a top in tech to be followed by a top in the other stocks after the laggards rise a little. Sell in May is also on the horizon. This is the time to be in cash and on the sidelines. The market discounts the future. It rose during the pandemic as it focused on the coming recovery. It would not be unusual for the market to decline during the economic recovery as it foresees inflation, higher rates and an exploding budget deficit. I prefer to stand back and wait for Mr. Market to reveal his intentions.
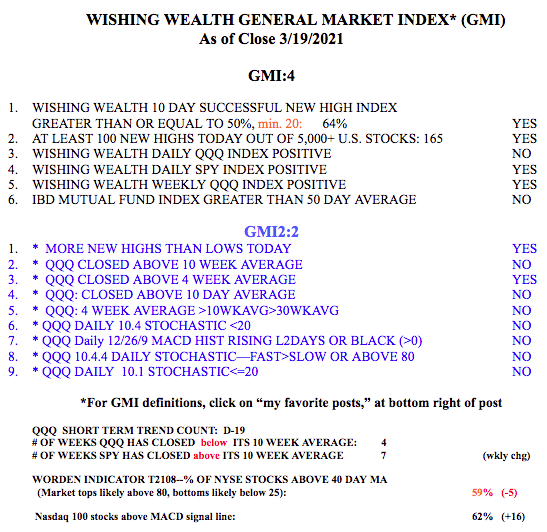
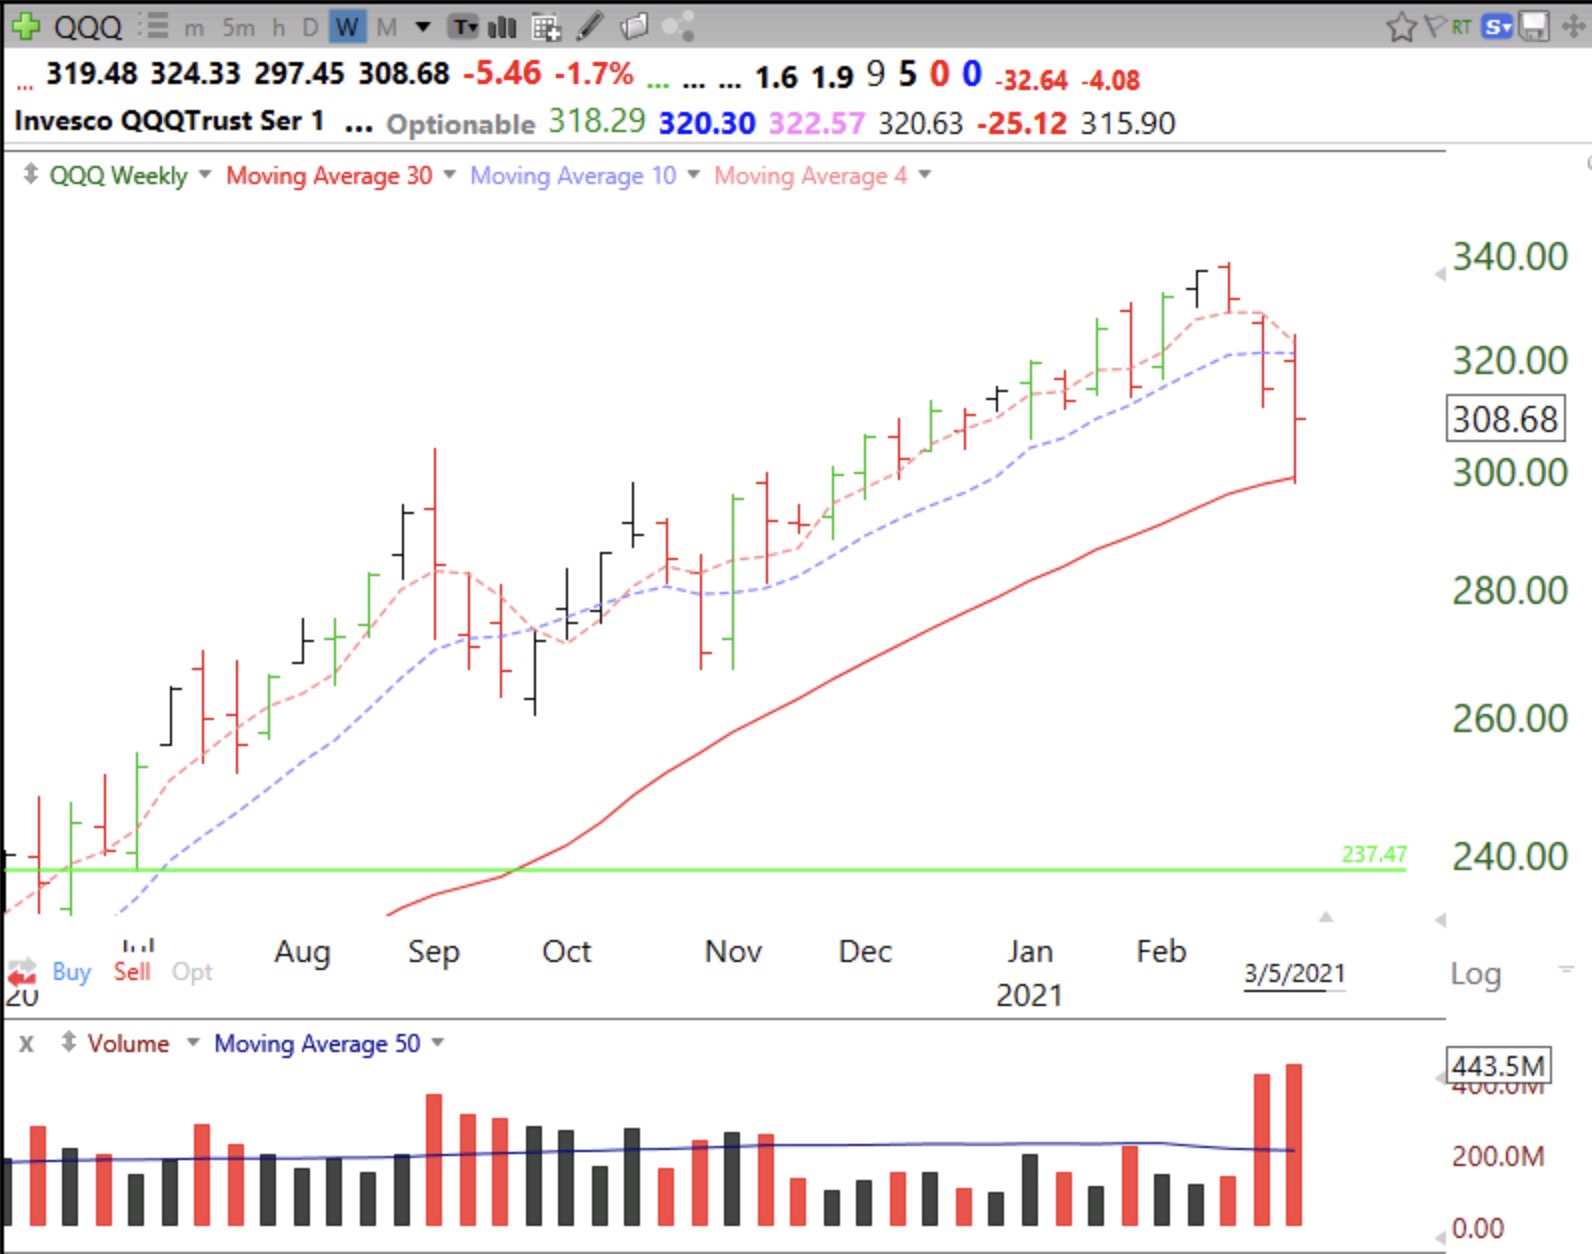
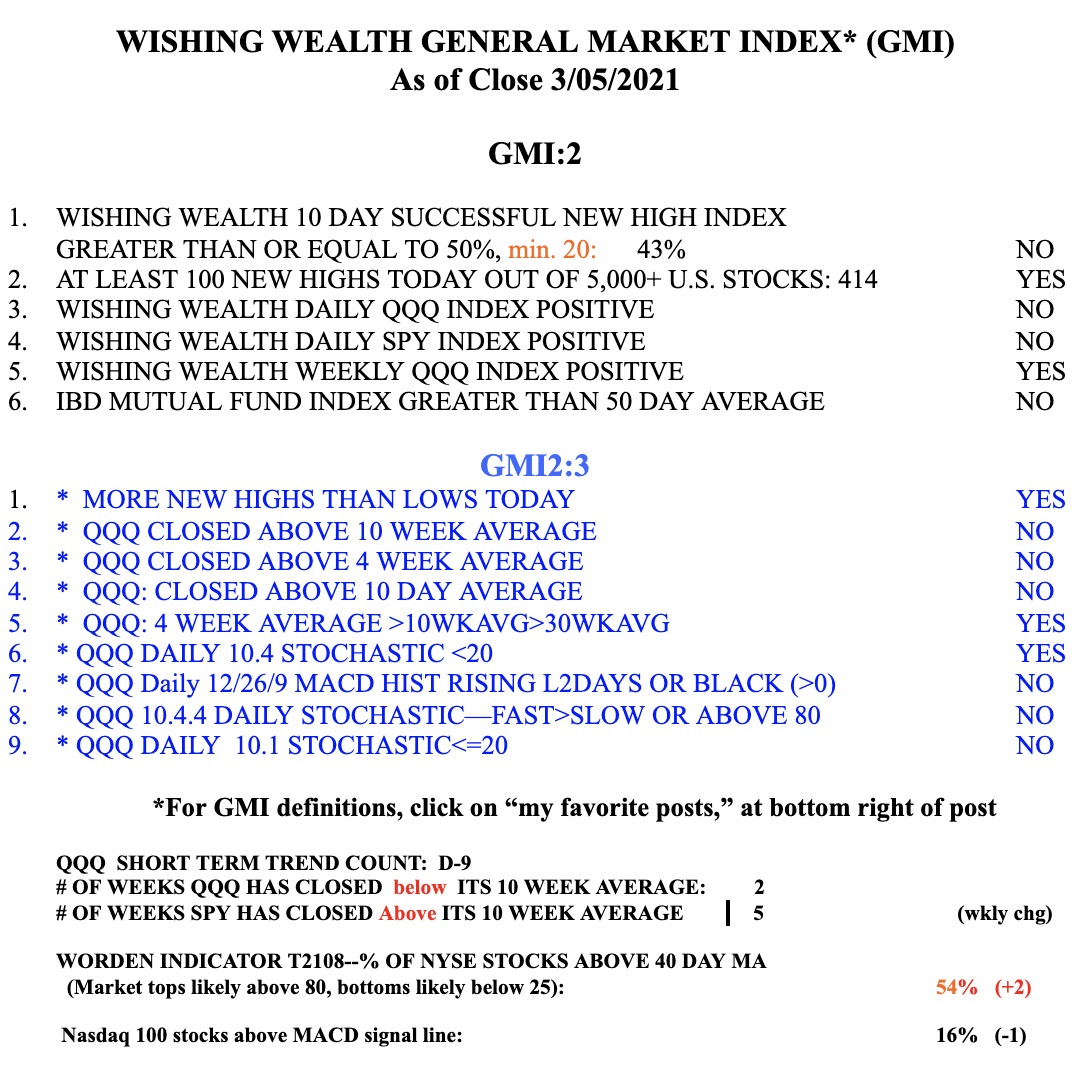
Note that the QQQ has been below its 10 week average for 4 weeks while SPY has remained above for 7 weeks. The GMI remains on a Green signal. Beware if it Turns Red.