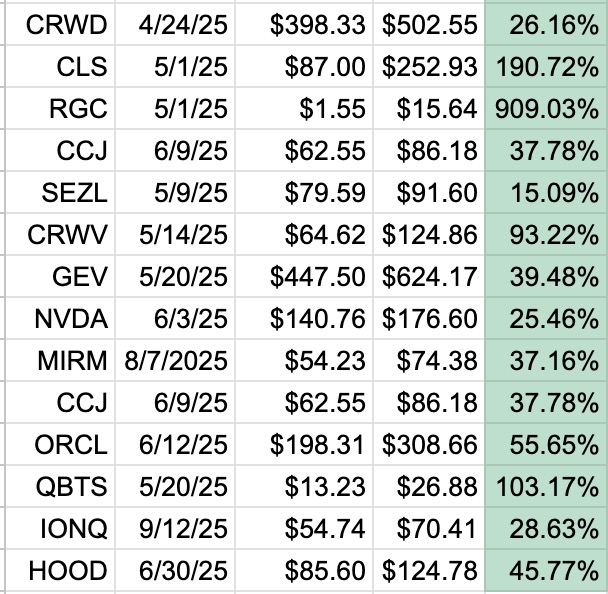
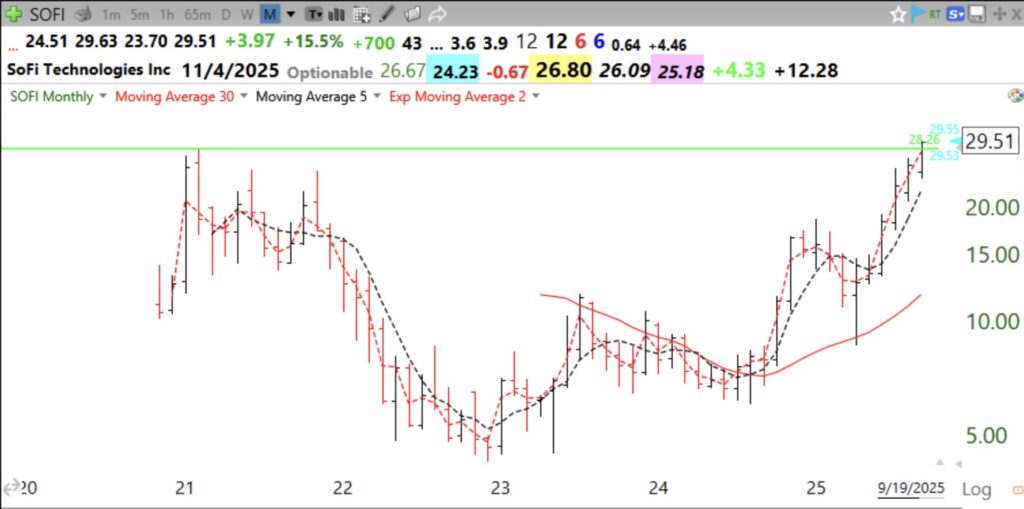
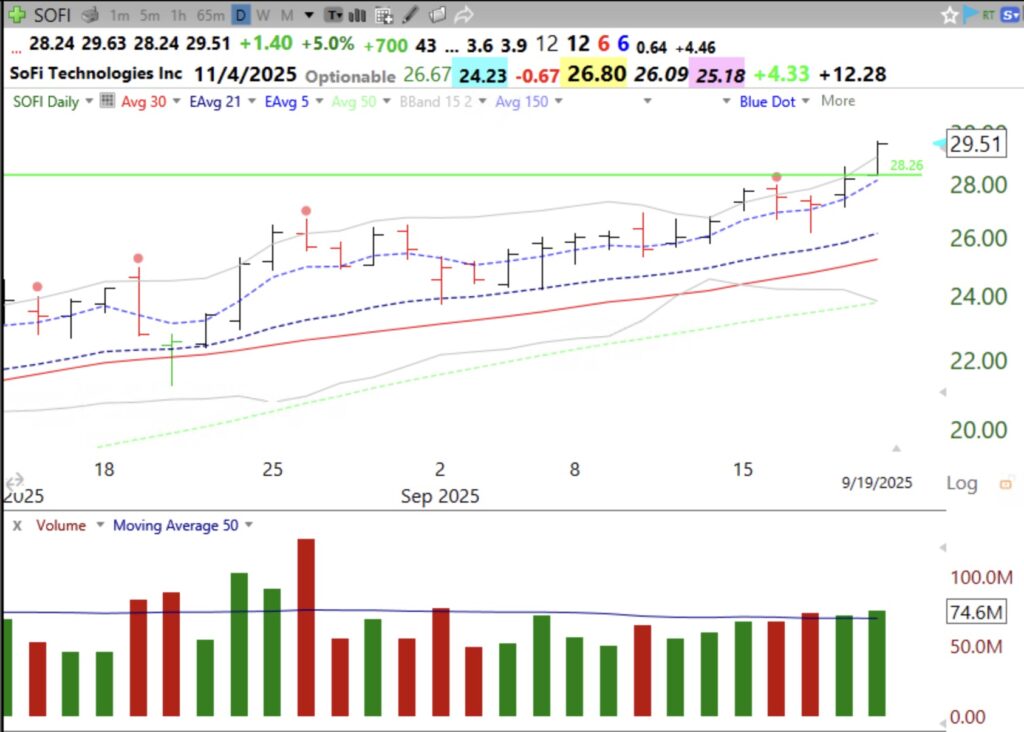
Anyone can show us collections of winning stocks that demonstrate how various technical setups have worked. But by definition, these setups work on strong rising stocks. Just buying every Friday could have yielded profits on a steadily rising stock. Traders can be misled into thinking that employing these winning setups will likely lead them to riches. False!!!! These collections do not show us the number of times that each setup fails, especially in a declining market! I think every one of these collections should include examples of the same setups when they fail in order to teach people that they must always control risk. Most traders say that 50% or more of their trades fail, thus implying that their own favorite setups often fail.
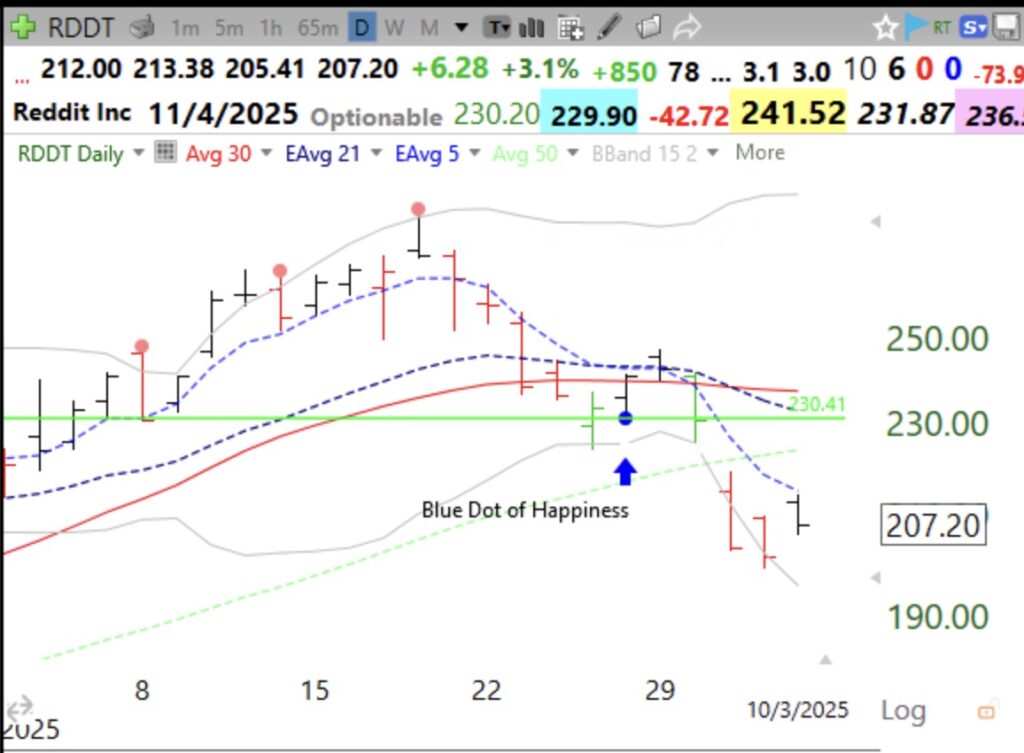
In January, on Day 6 of the TraderLion annual conference, I introduced the Blue Dot of Happiness setup and did show times it had failed. I want to show you a recent failure in a stock I was following. Look at this daily chart of RDDT. RDDT had a GLB to an ATH and then came back to retest the green line. It then bounced off of the green line with an oversold bounce=blue dot, a beautiful setup. IT THEN FAILED!!! Remember that I sell immediately if a GLB fails if the stock closes back below the green line.
So even if you think you have discerned the best setup for your trades, you must be prepared to exit if/when it fails. This is half the battle for success in the market, as long as we exit quickly with a small loss. The famous successful turtle traders were taught to enter every trade with the expectation it would fail, see Covel’s excellent book on this blog. That way they recognized failure quickly and were prepared to act on it. I teach students that every failed trade brings me to the next profitable trade.
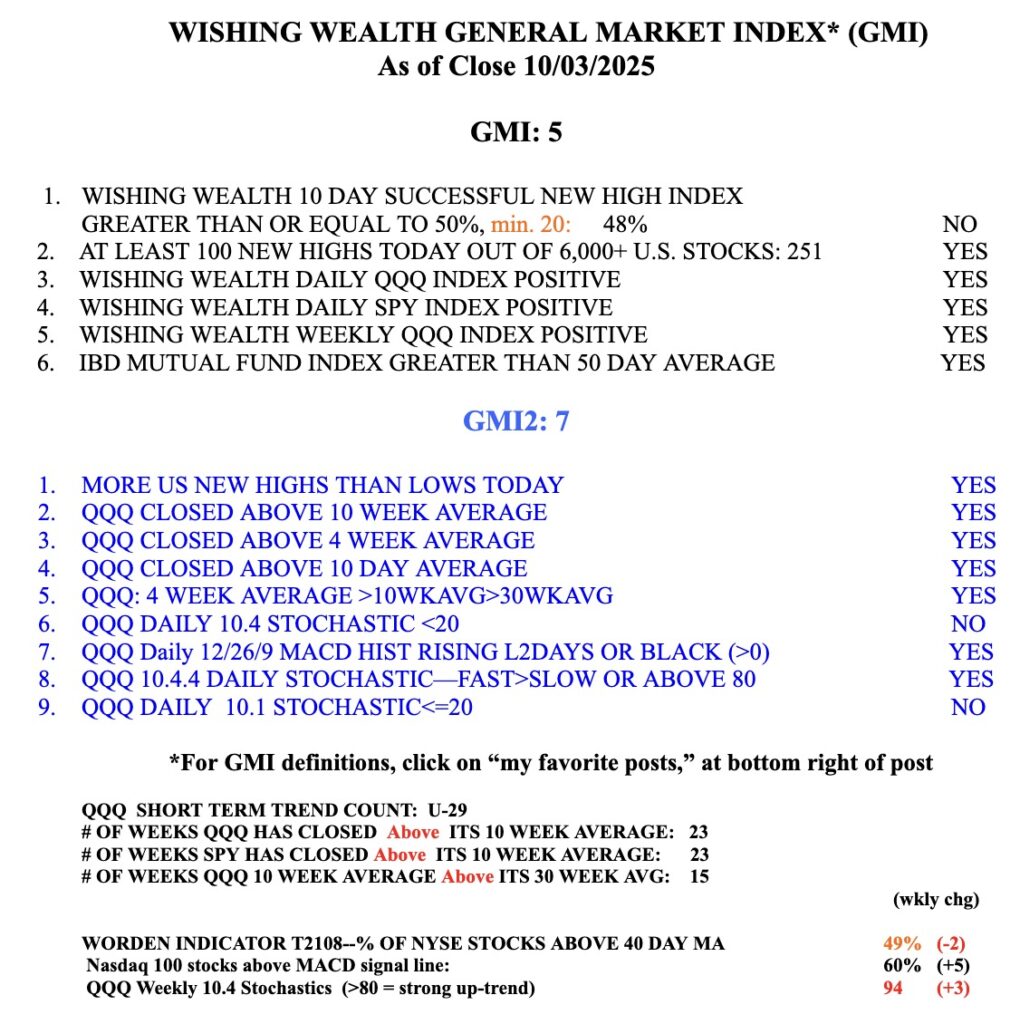
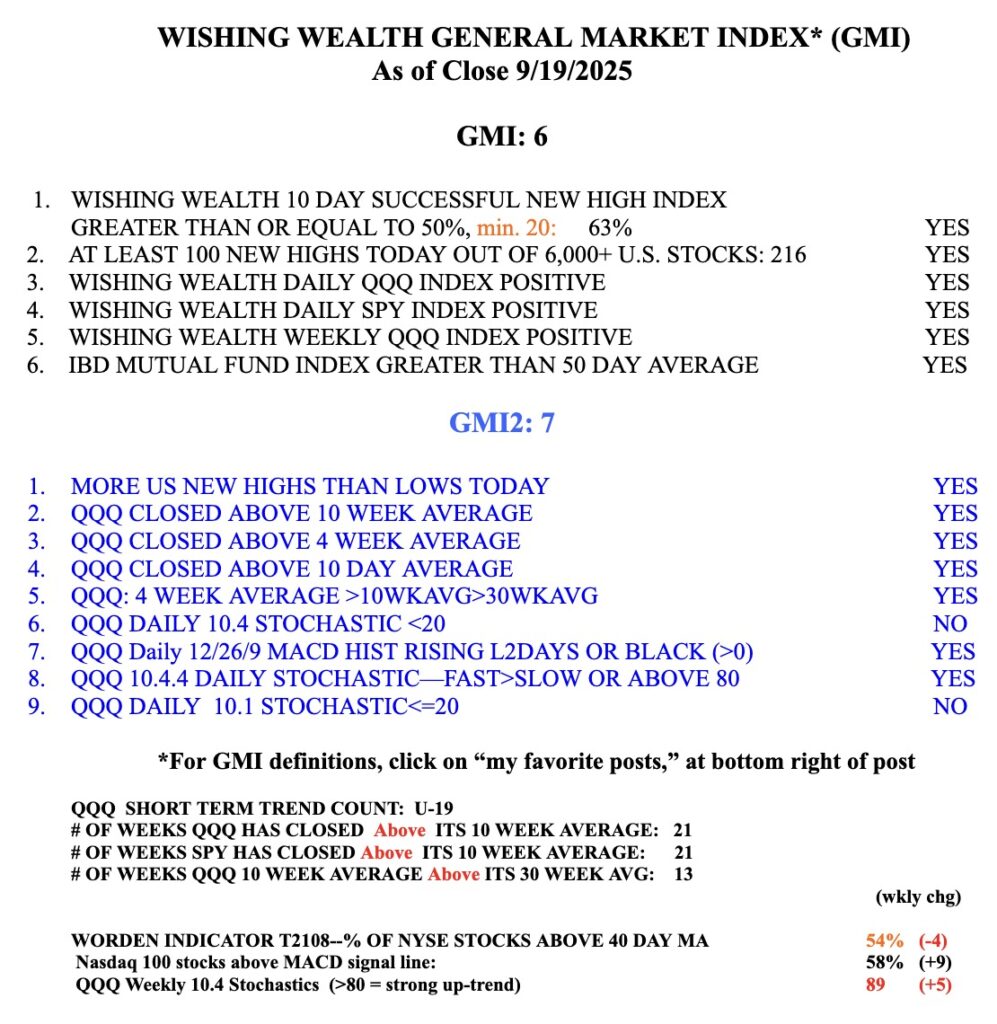
The GMI= 5 (of 6) and remains on a Green signal.
