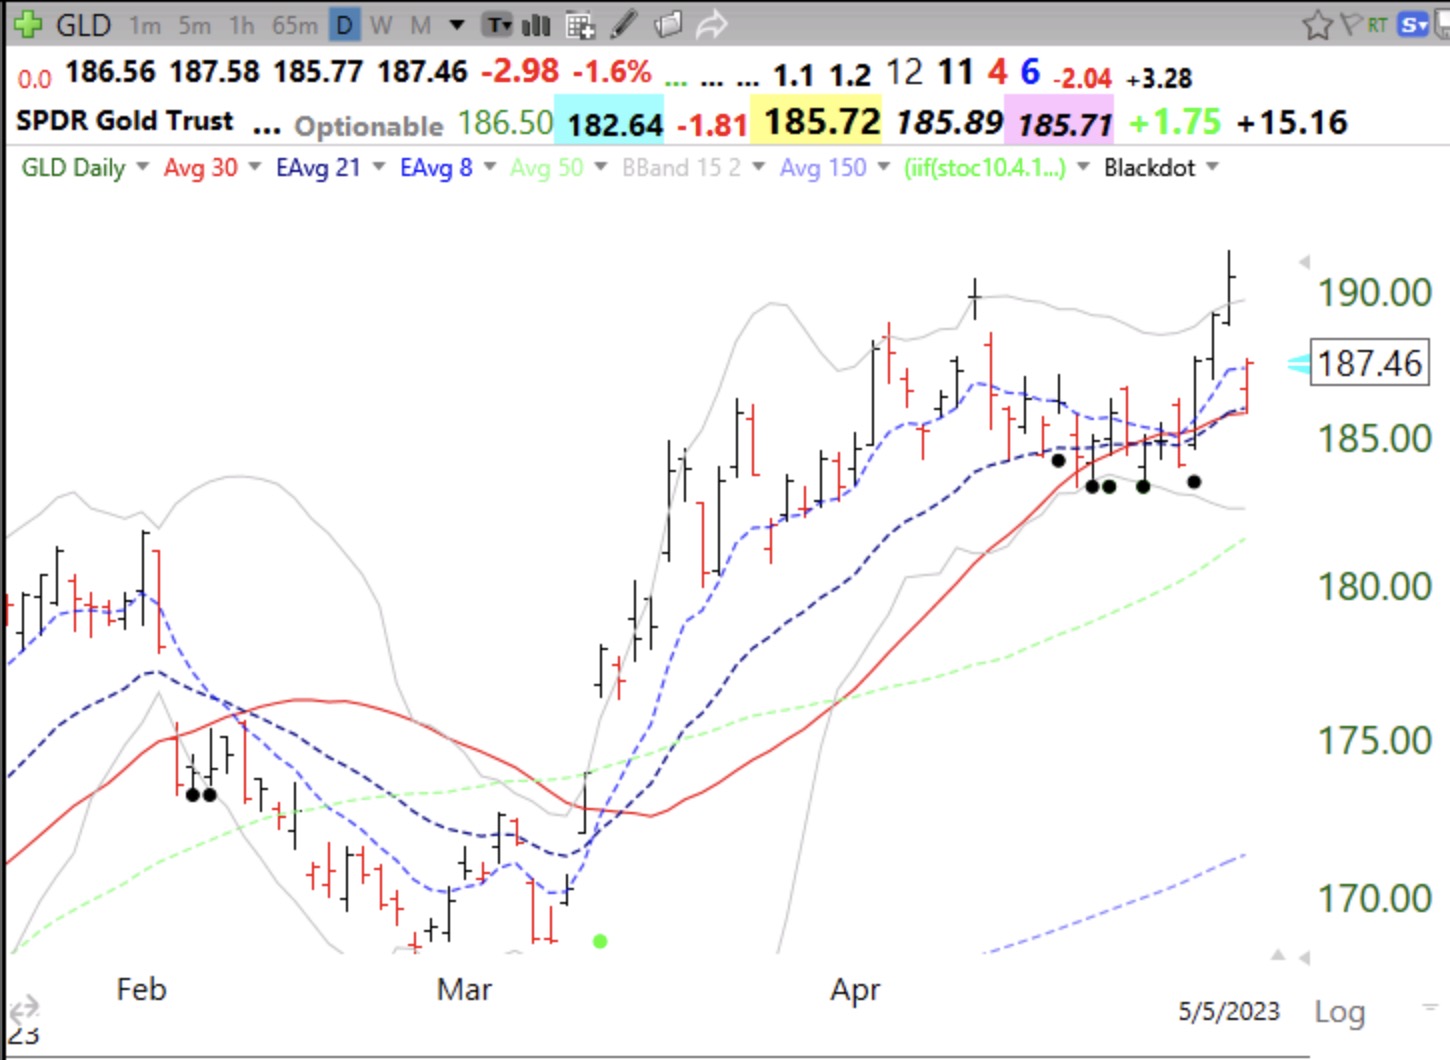
The GMI and $QQQ short term up-trend survived close calls last week. Normally the end of earnings period brings about market softness, and it is Sell in May time. I am mainly in cash and hold some GLD. We should know by Tuesday, after the White House meeting, whether we are likely to have a repeat of the 2011 debt ceiling crisis. If we do, then gold and long term treasuries should do well, based on my review of 2011 trends during that fight over raising the debt. Scared investors hide out in precious metals. Once we get by a possible debt crisis I will be more comfortable owning stocks. On Friday, GLD gapped down but closed near its daily high. It is important that it hold Friday’s low of 185.77. That is near the 30 day SMA and 21 day EMA.
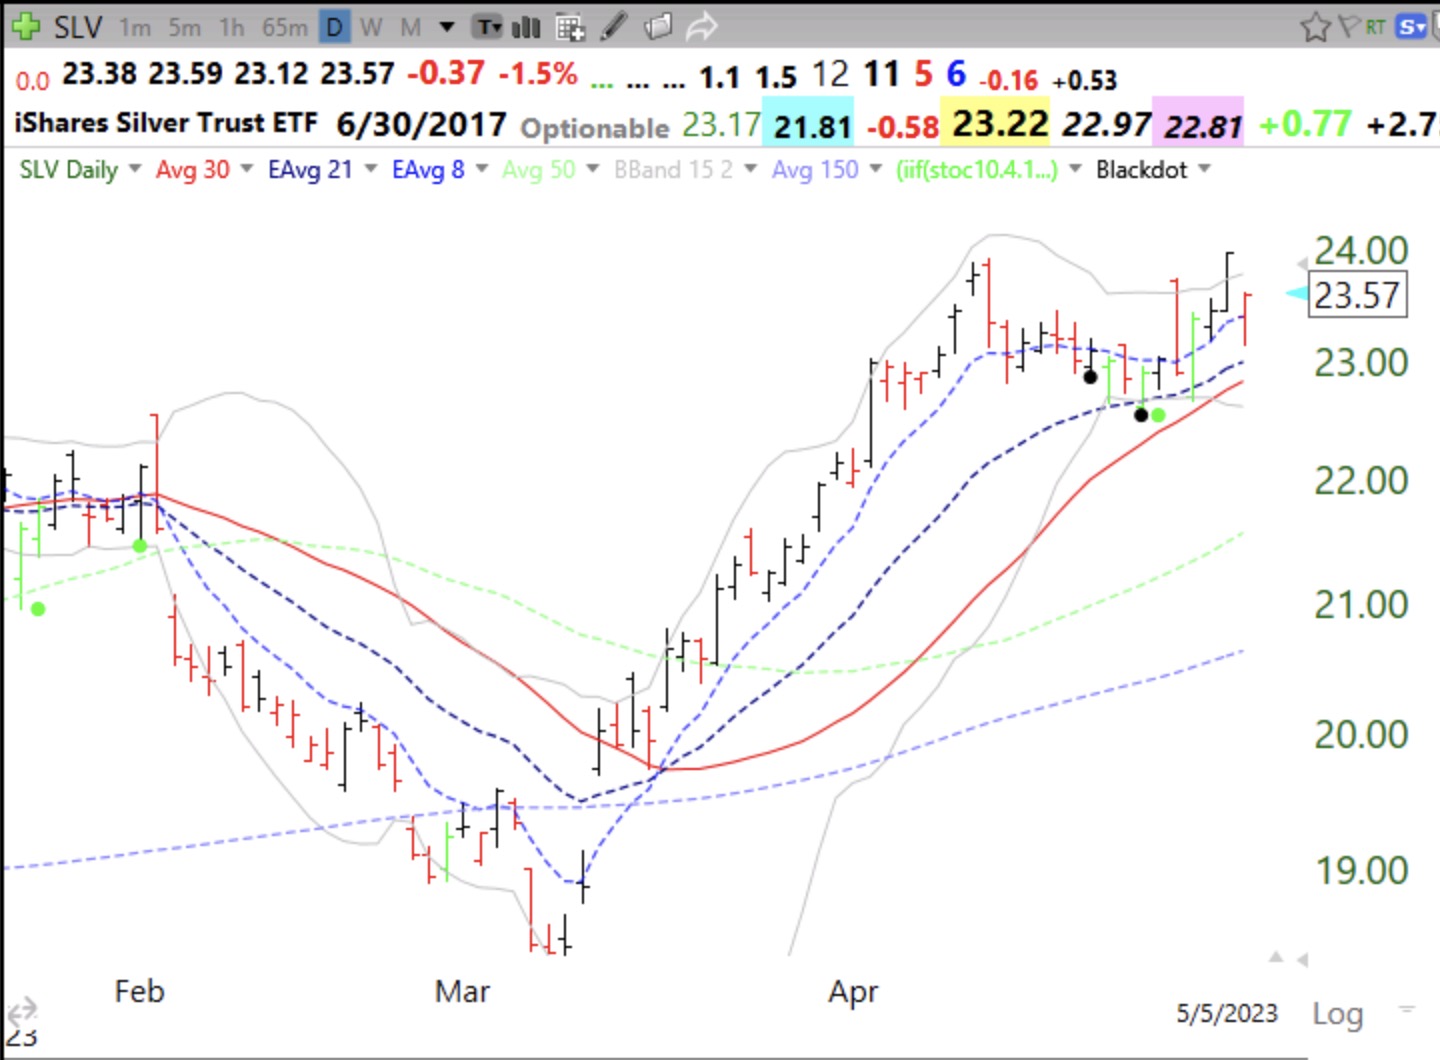
Silver (SLV) chart looks almost identical to that of gold.
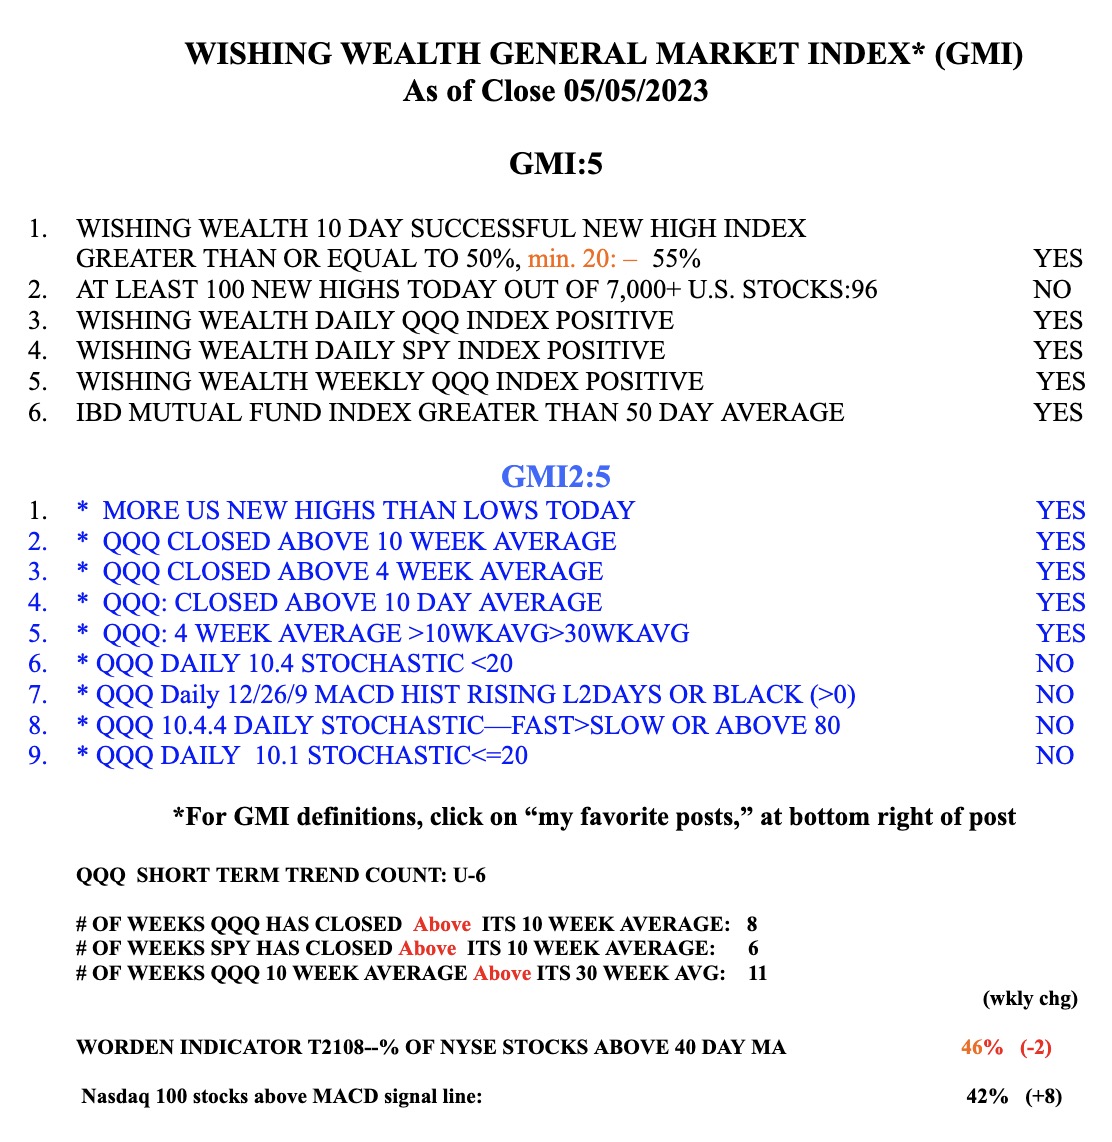
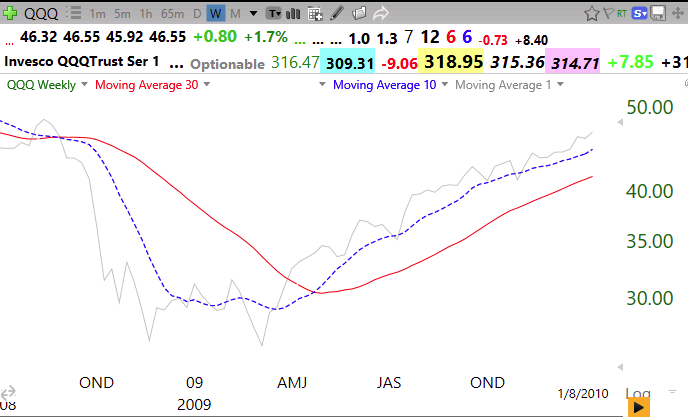
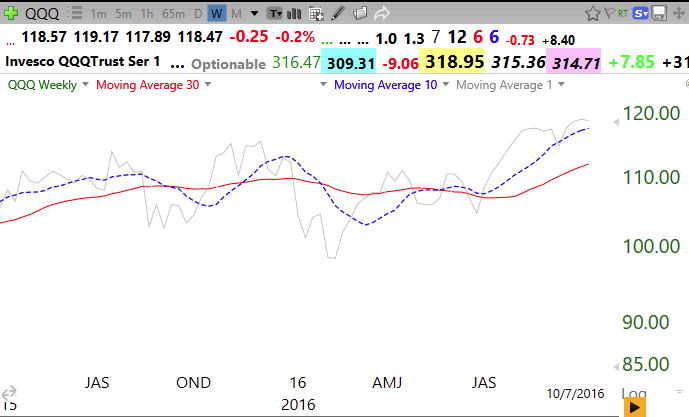
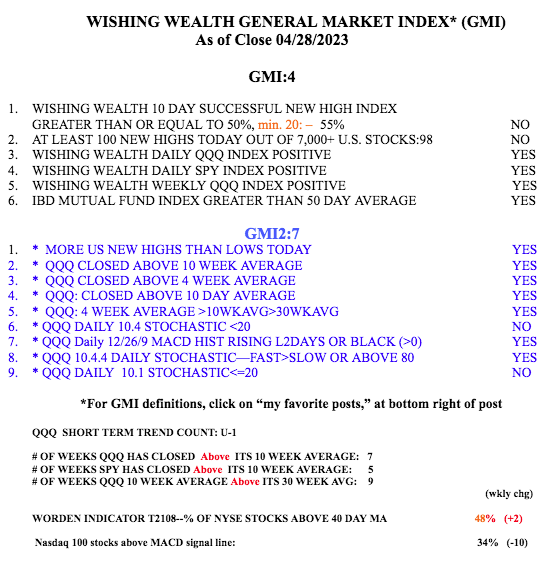
The GMI = 5 (of 6) and remains on a green signal. Note that QQQ’s 10 wk avg has been above its 30 wk avg for 11 straight weeks. That tells me the bear market bottom is likely established, unless it fails.