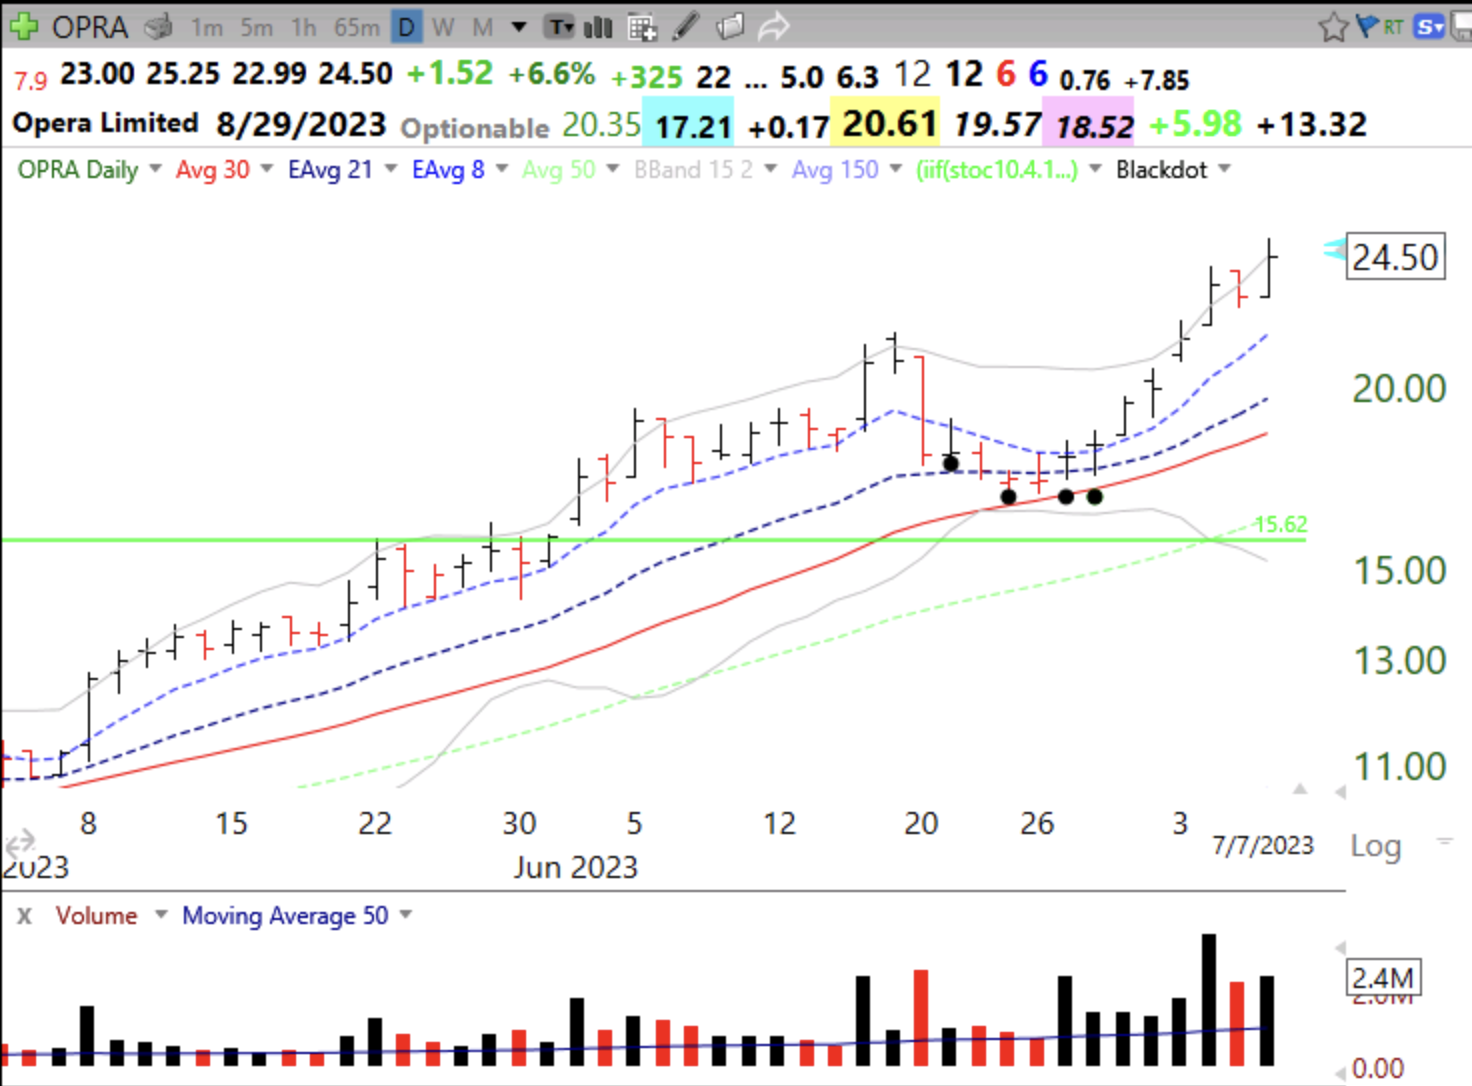
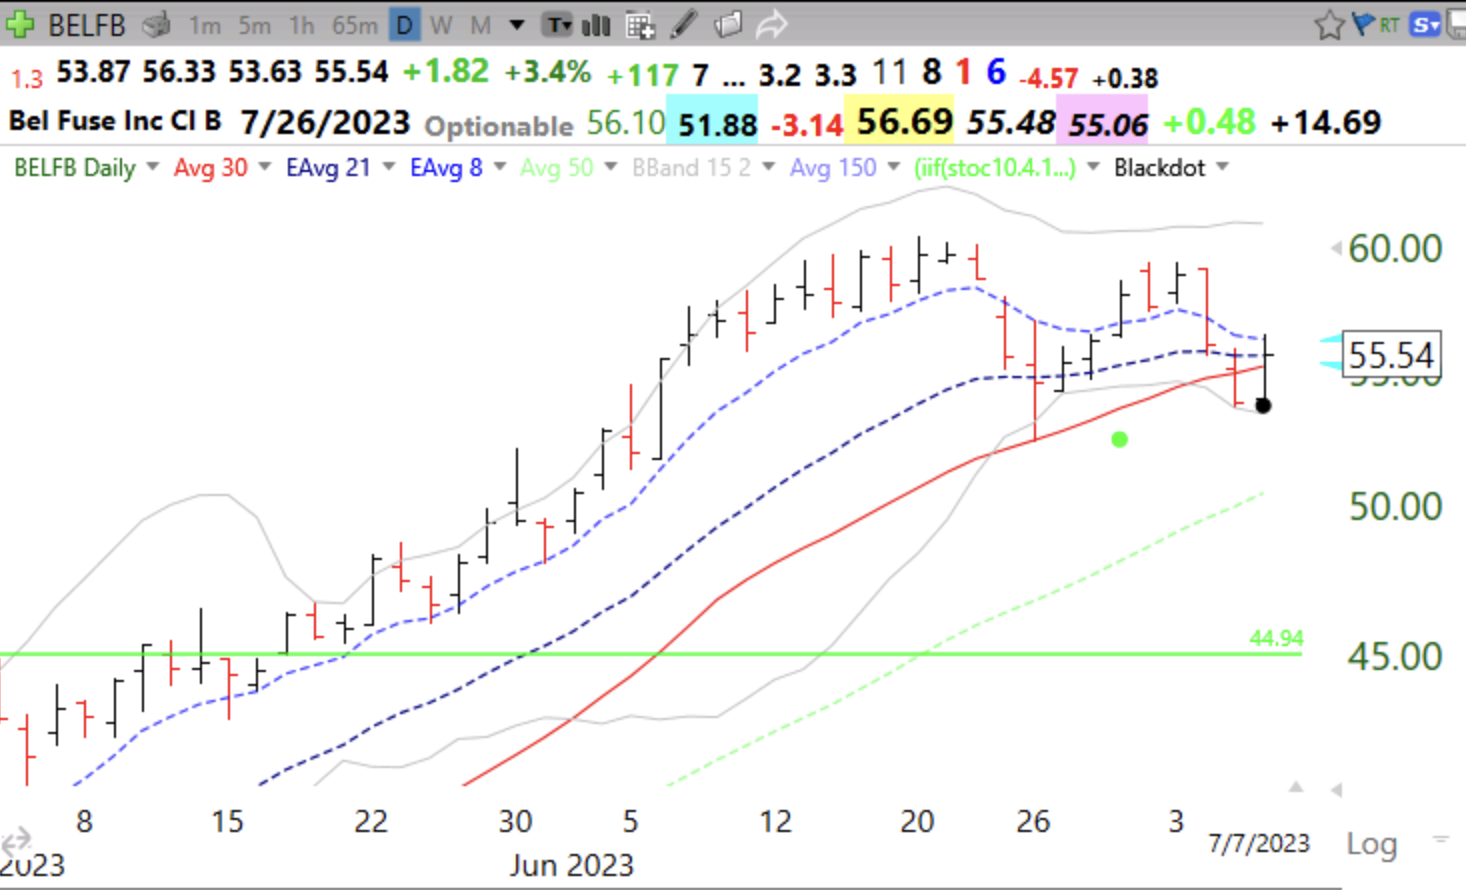
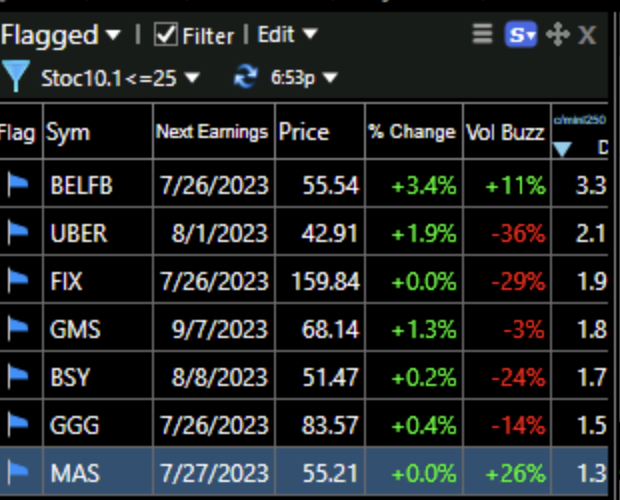
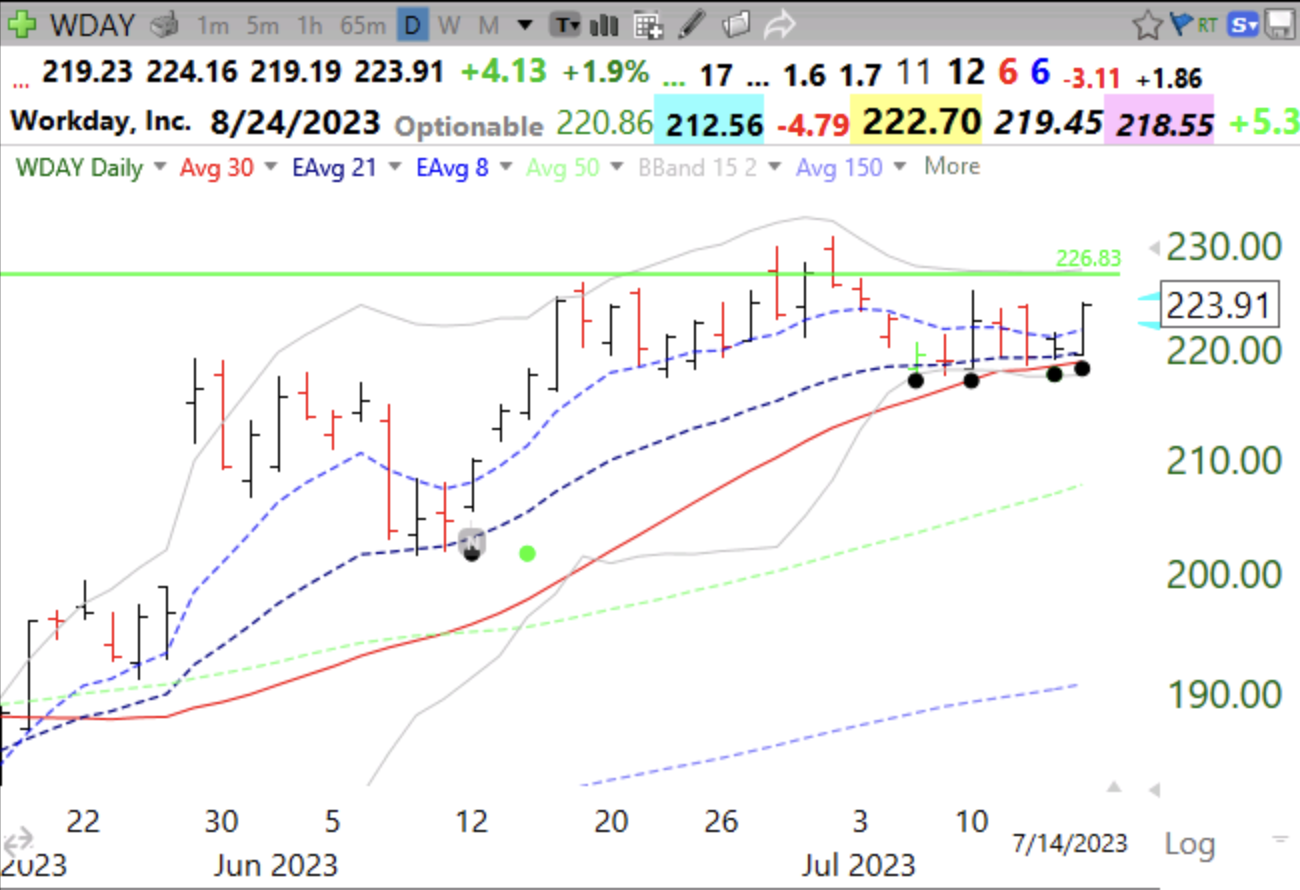
As I have written recently I like my Black Dot OSB set-up. These stocks have hit a recent new high and bounced up from oversold. After researching the fundamentals, I might buy one of these stocks and place my sell stop below the low of the bounce. If the bounce fails I exit immediately with a small loss. I like WDAY the best of the three stocks that came from my IBD/MS watchlist of promising stocks. WDAY has had several black dots and is also finding support near its bottom 15.2 Bollinger Band. Note the prior successful black dot bounce in mid June. The “N” indicates a note I wrote after buying it.
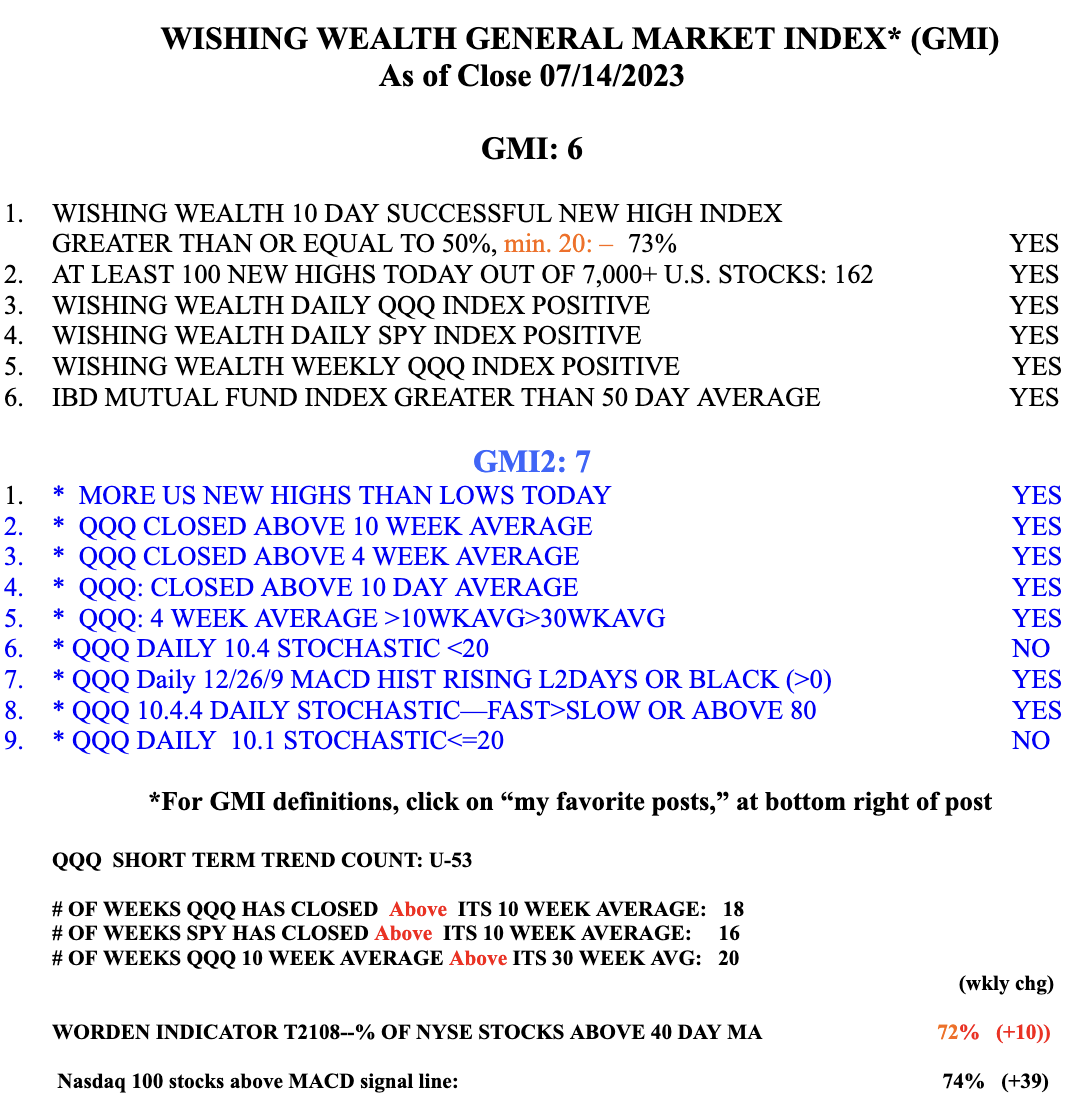
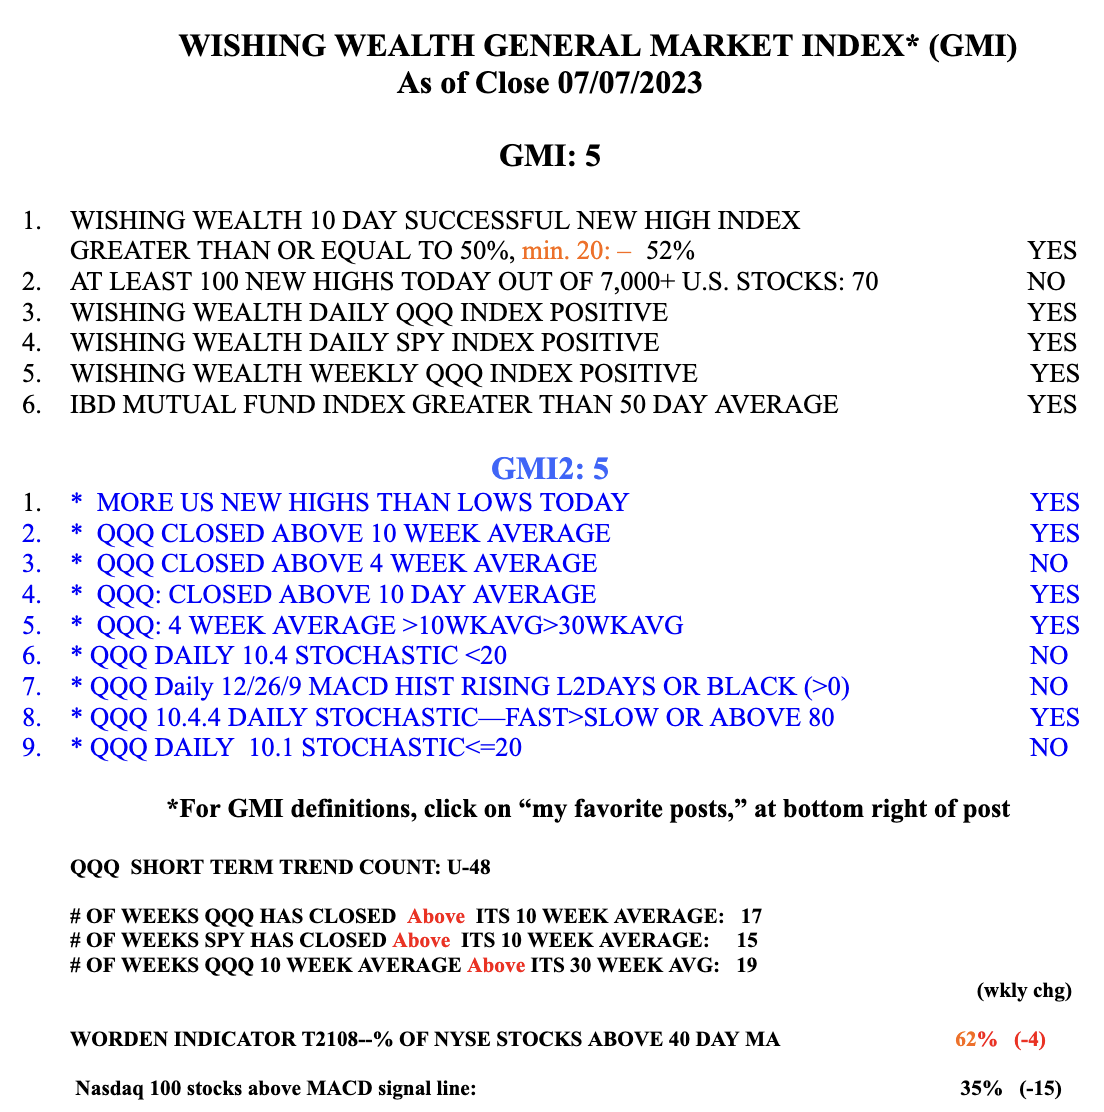
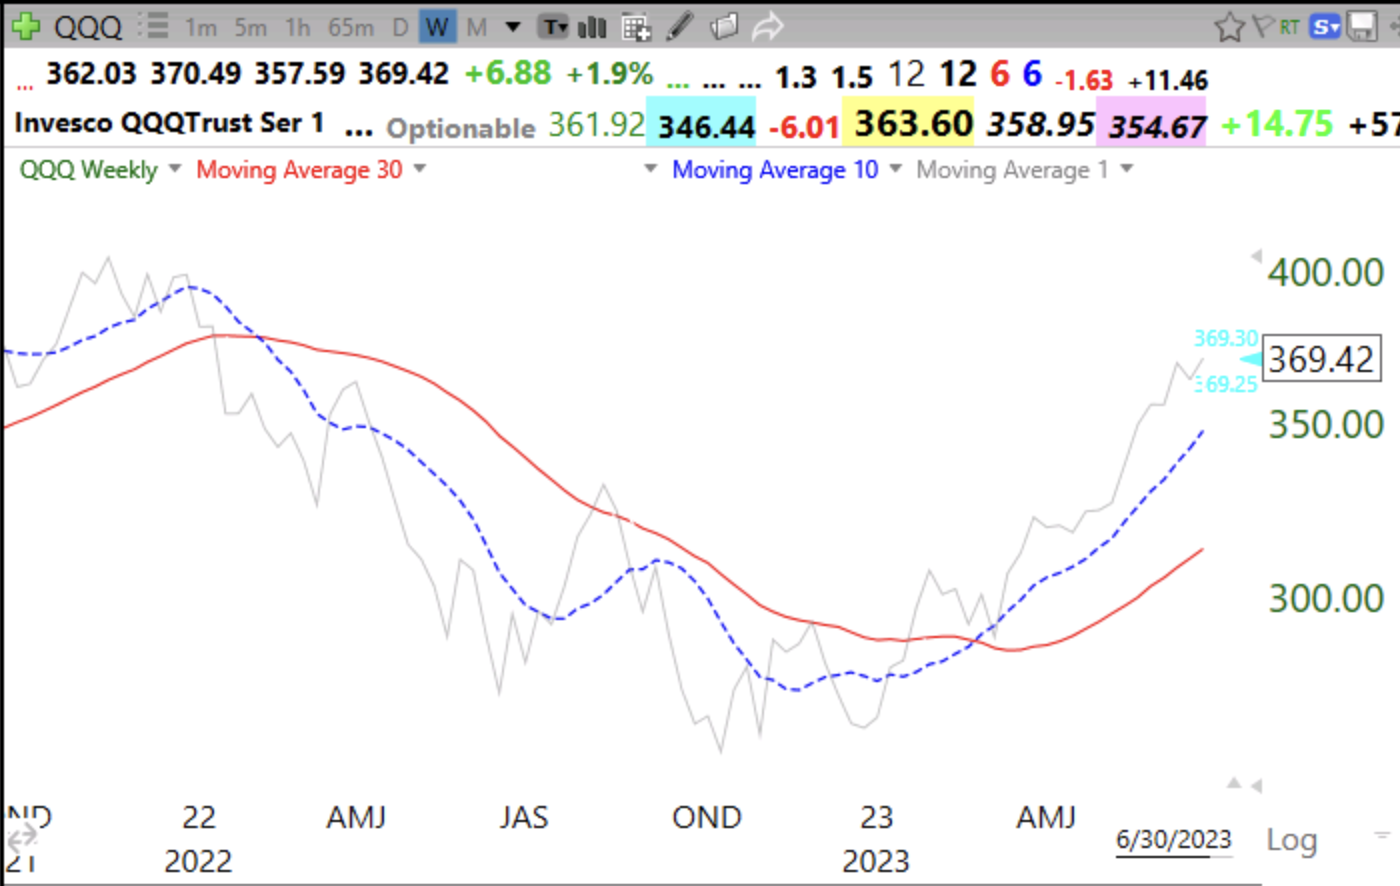
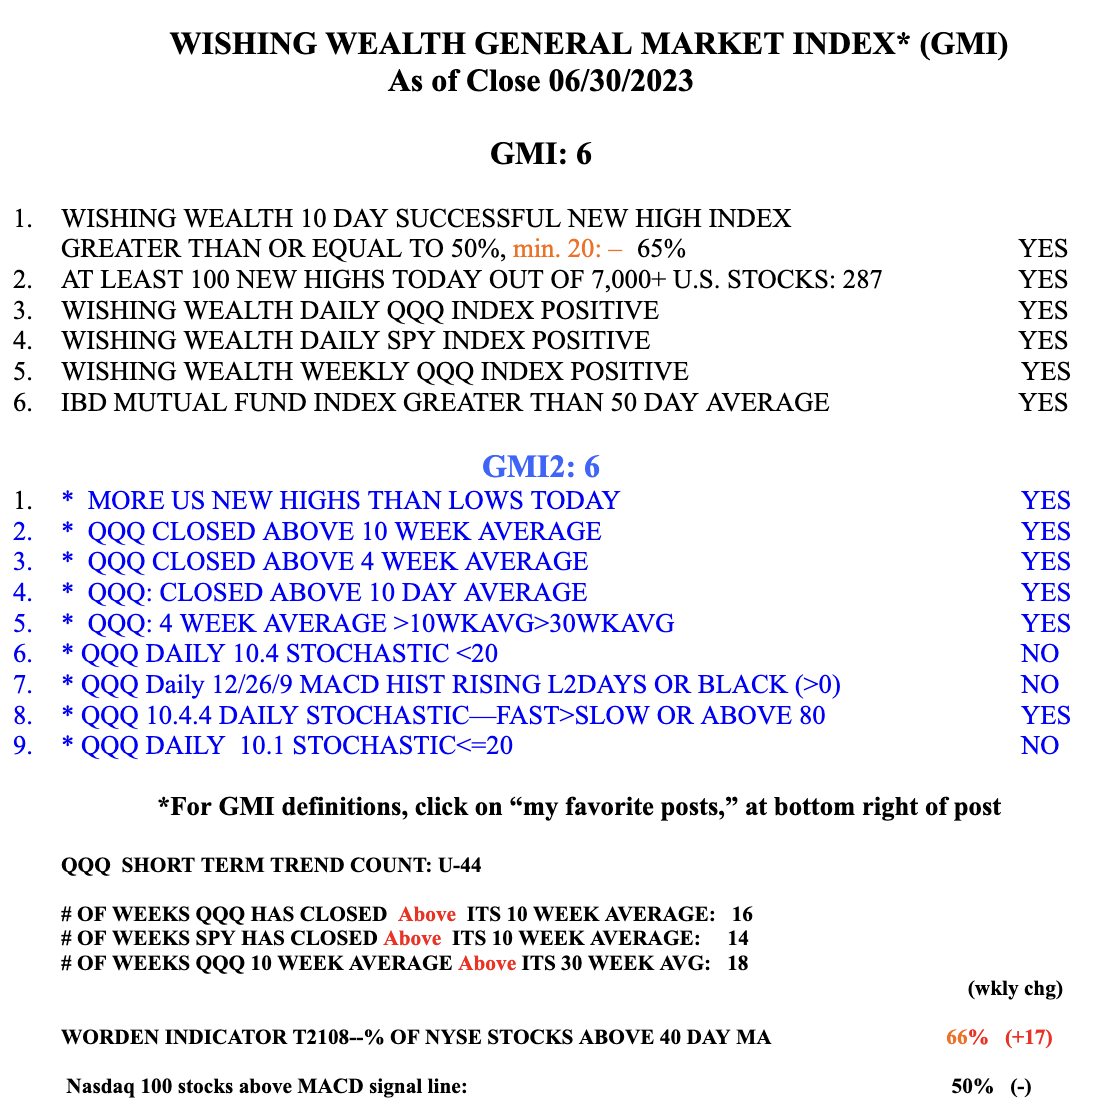
My short and longer term indicators remain positive.