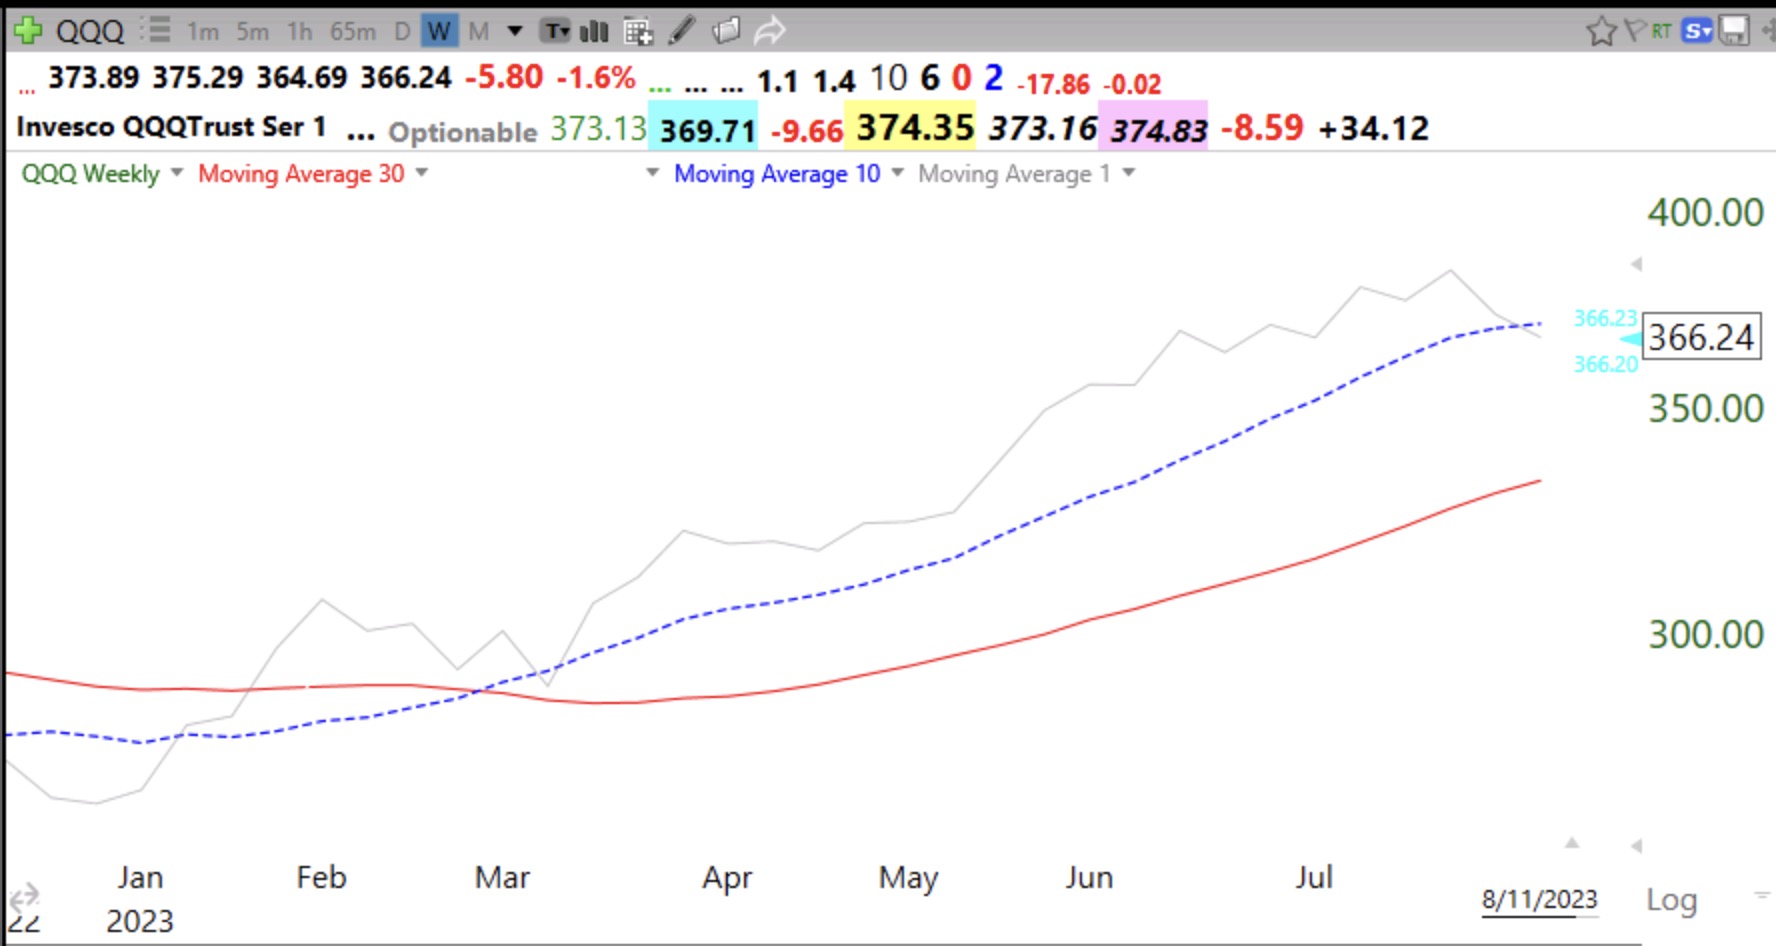
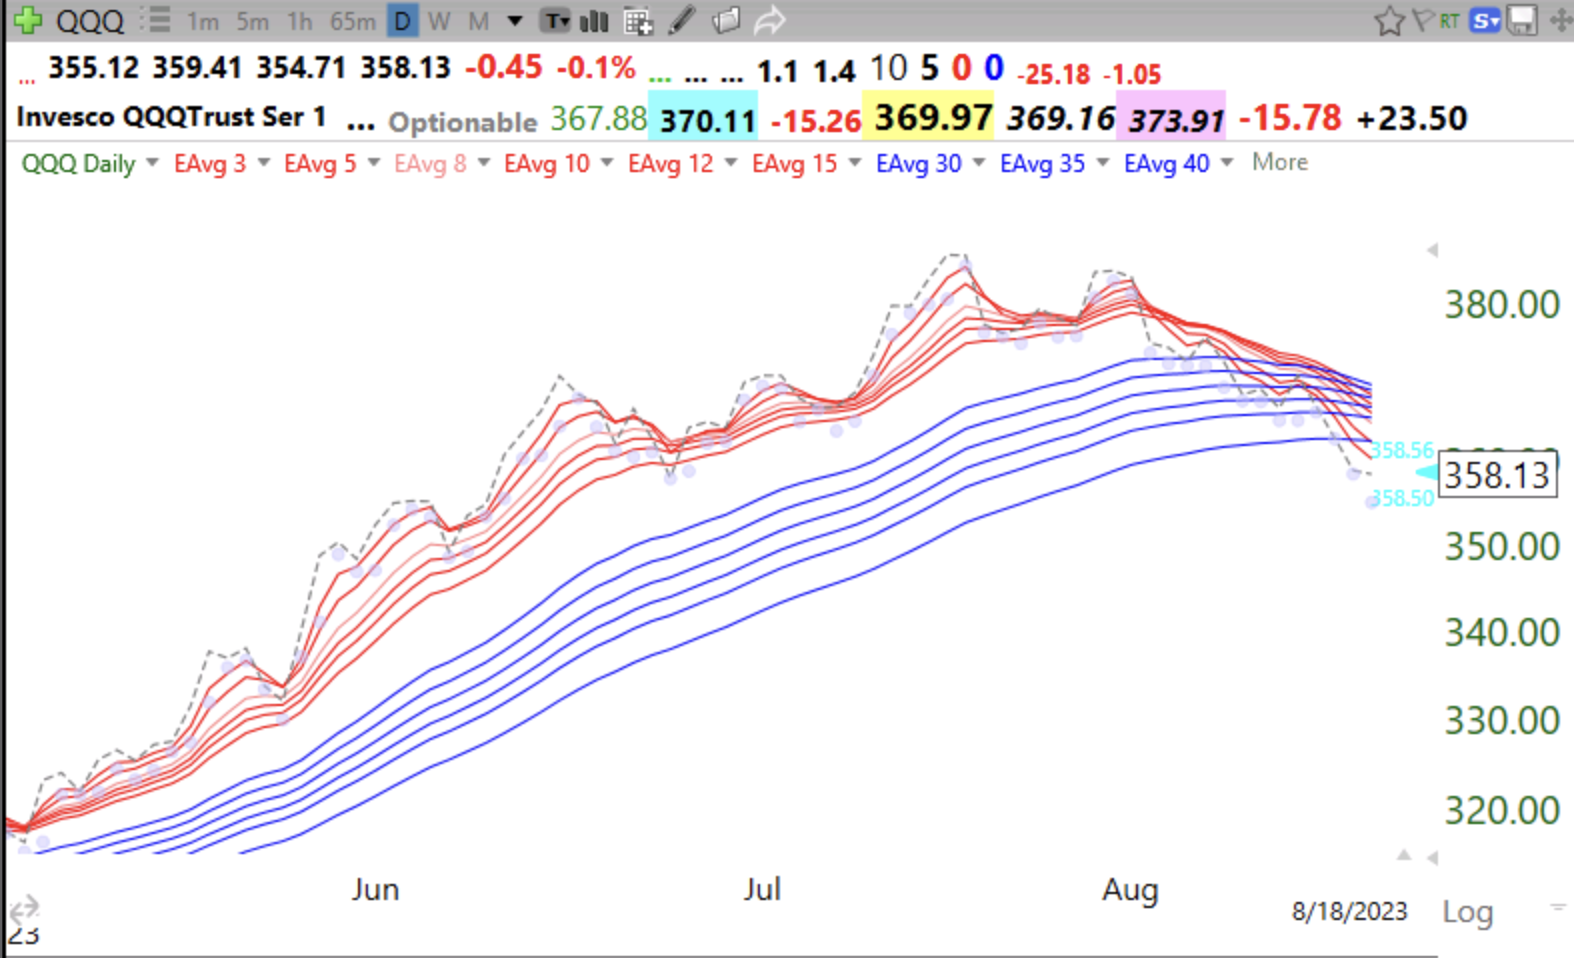
My modified daily Guppy charts show that the RWB up-trends are over and with the major indexes closing below (dotted line) all 12 averages, it is possible we will see BWR down-trends (shorter term red lines declining below blue lines with a white space between them). The key in technical analysis is to be prepared to react once a trend is in. Friday was the 8th day of the current $QQQ short term down-trend. Being long right now is fighting the tide. It is so much easier to profit on the long side when the GMI is Green and the short term trends are up. Here is the daily modified Guppy chart of QQQ. All of the major indexes have similar patterns. We are in the post earnings release period when the market tends to wander or decline. When the third quarter earnings are released in October, we might see a new up-trend. The post earnings decline sets up the next rise. But rather than predict, I prefer to wait and then react. I currently am in cash and SQQQ and own a little ACHR in my trading IRA.
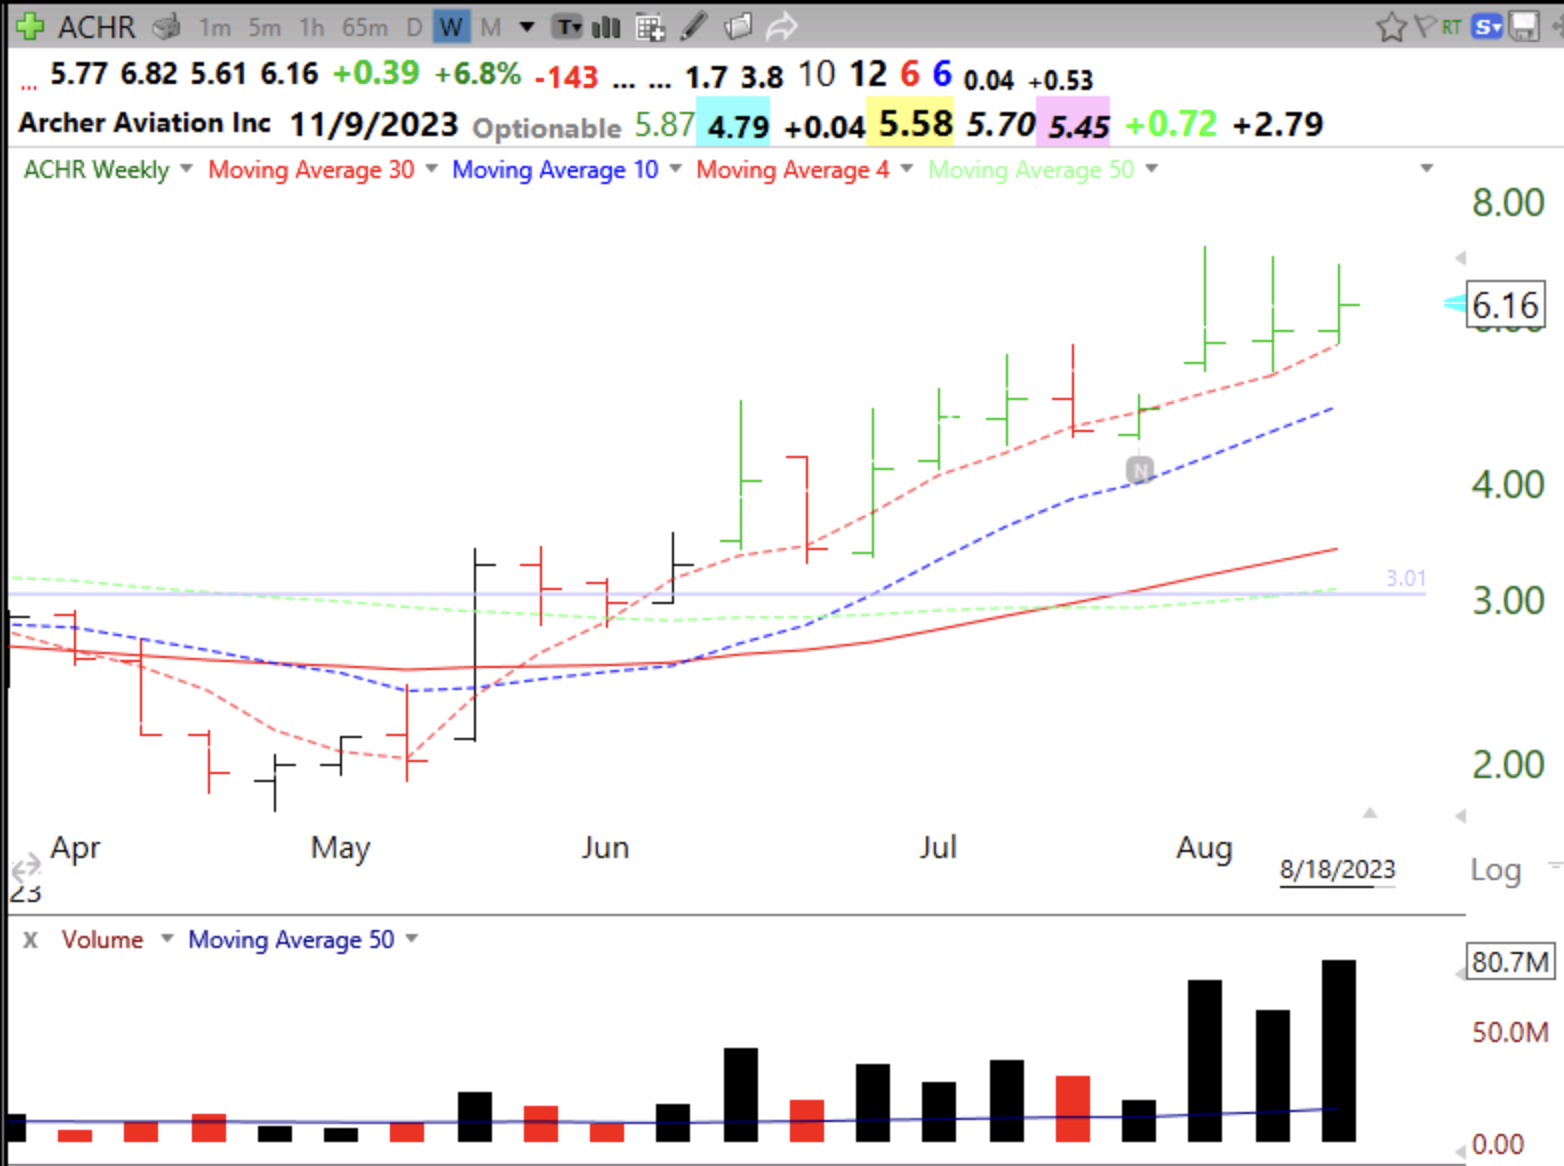
ACHR is a leader in the new electric vertical takeoff and landing industry. Cathy Wood is buying it and the weekly chart just looks very promising to me. Note the volume the past 3 weeks as ACHR has resisted the market decline. I almost never buy cheap stocks but my stock buddy, Judy, alerted me to this new industry a long time ago. I posted about it a while ago and I own a few shares as a bookmark. I want to see it hold its rising 4 wk average (red dotted line).
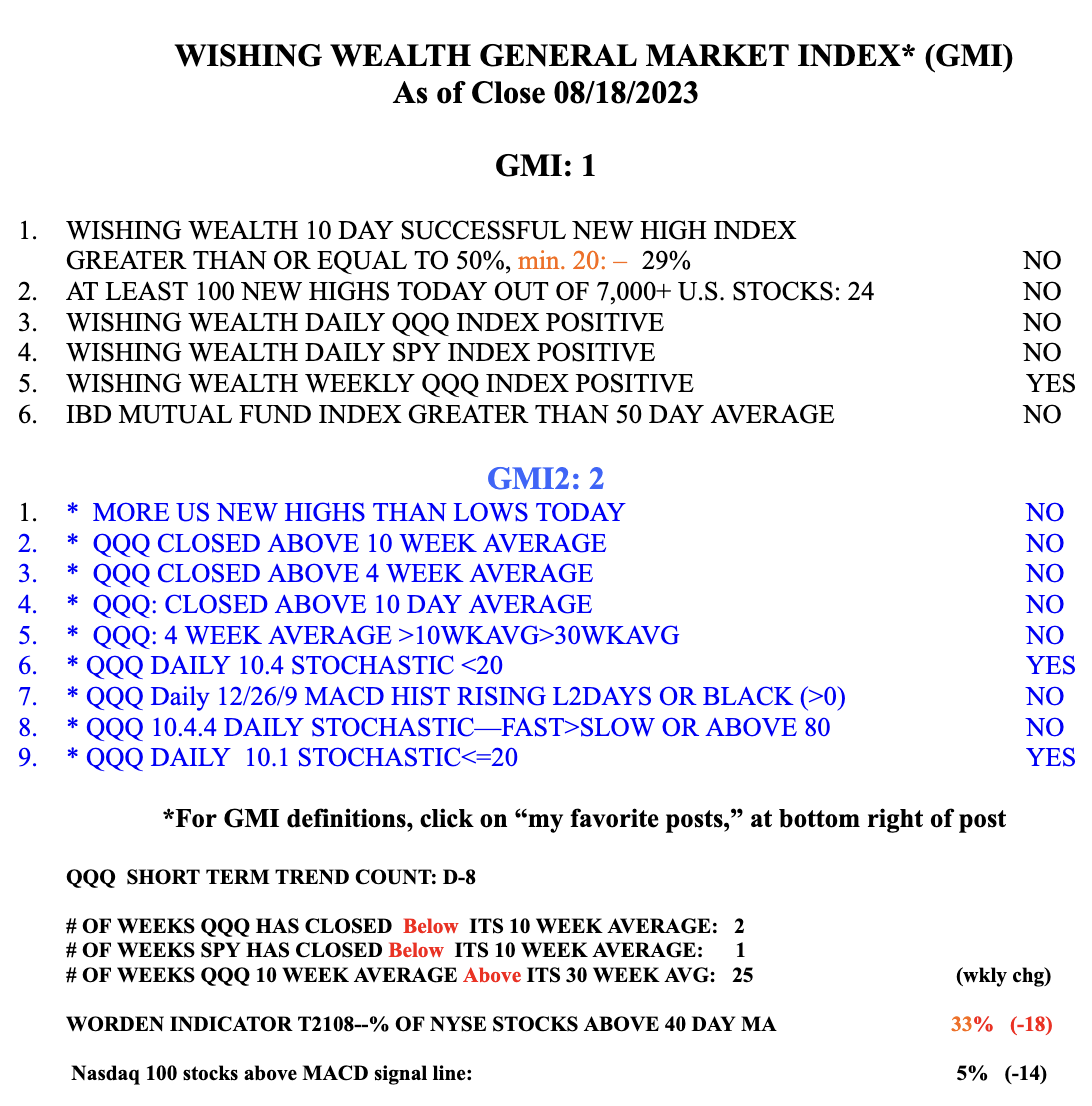
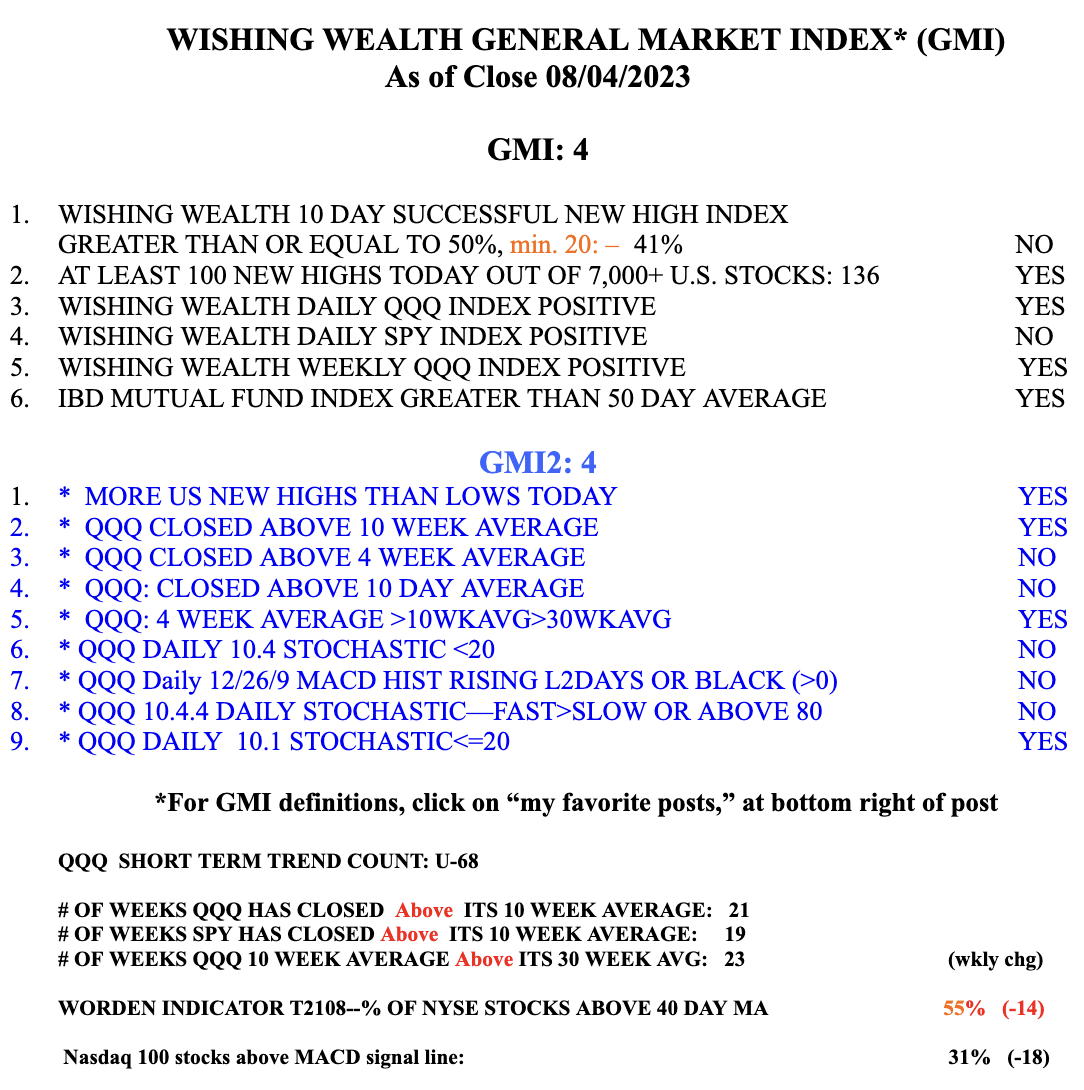
The GMI remains Red. Both QQQ and SPY have closed below their 10 week averages. But the longer term trend of QQQ remains up with the 10 week above the 30 week for the 25th consecutive week.