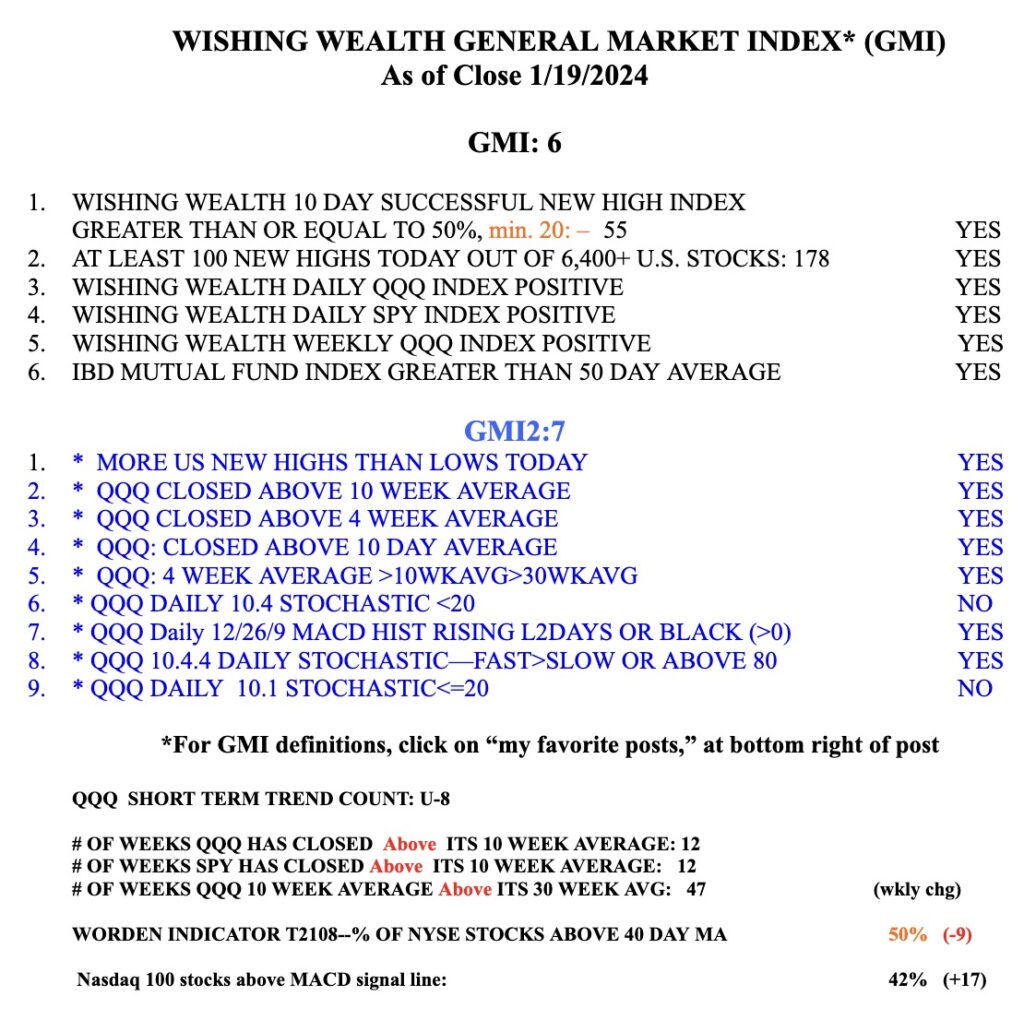
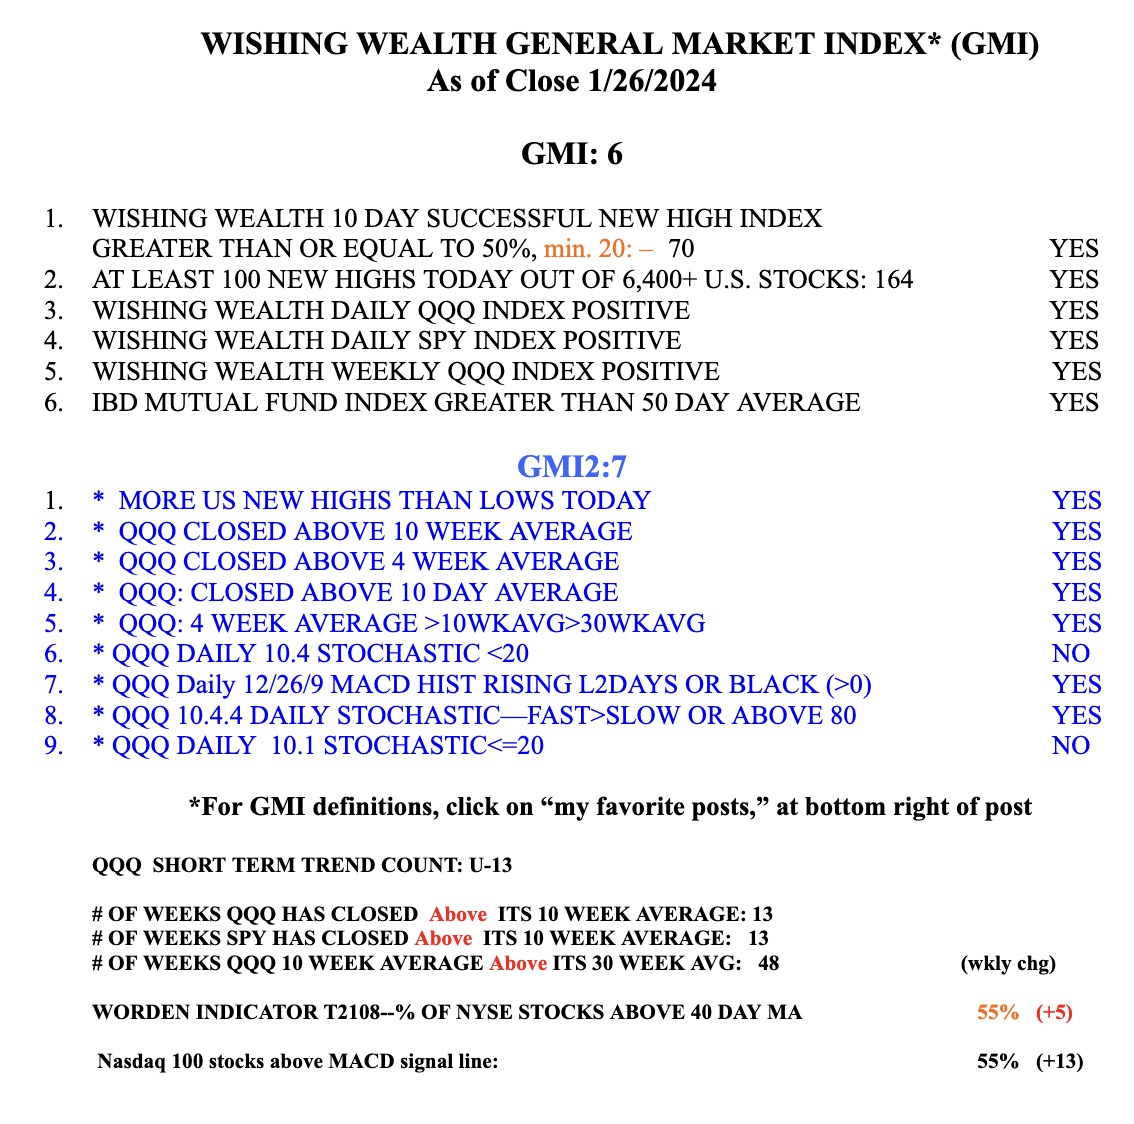
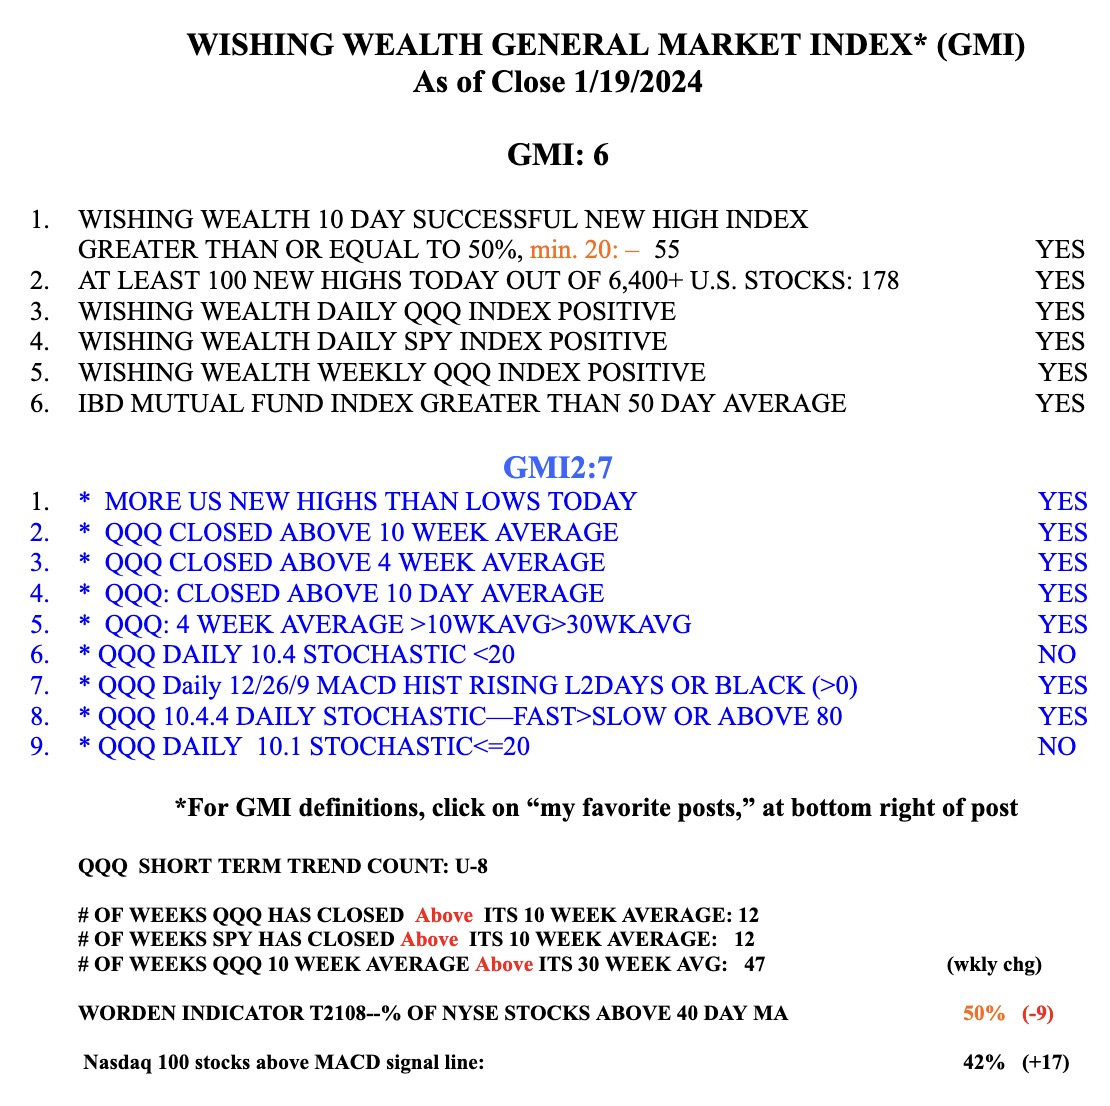
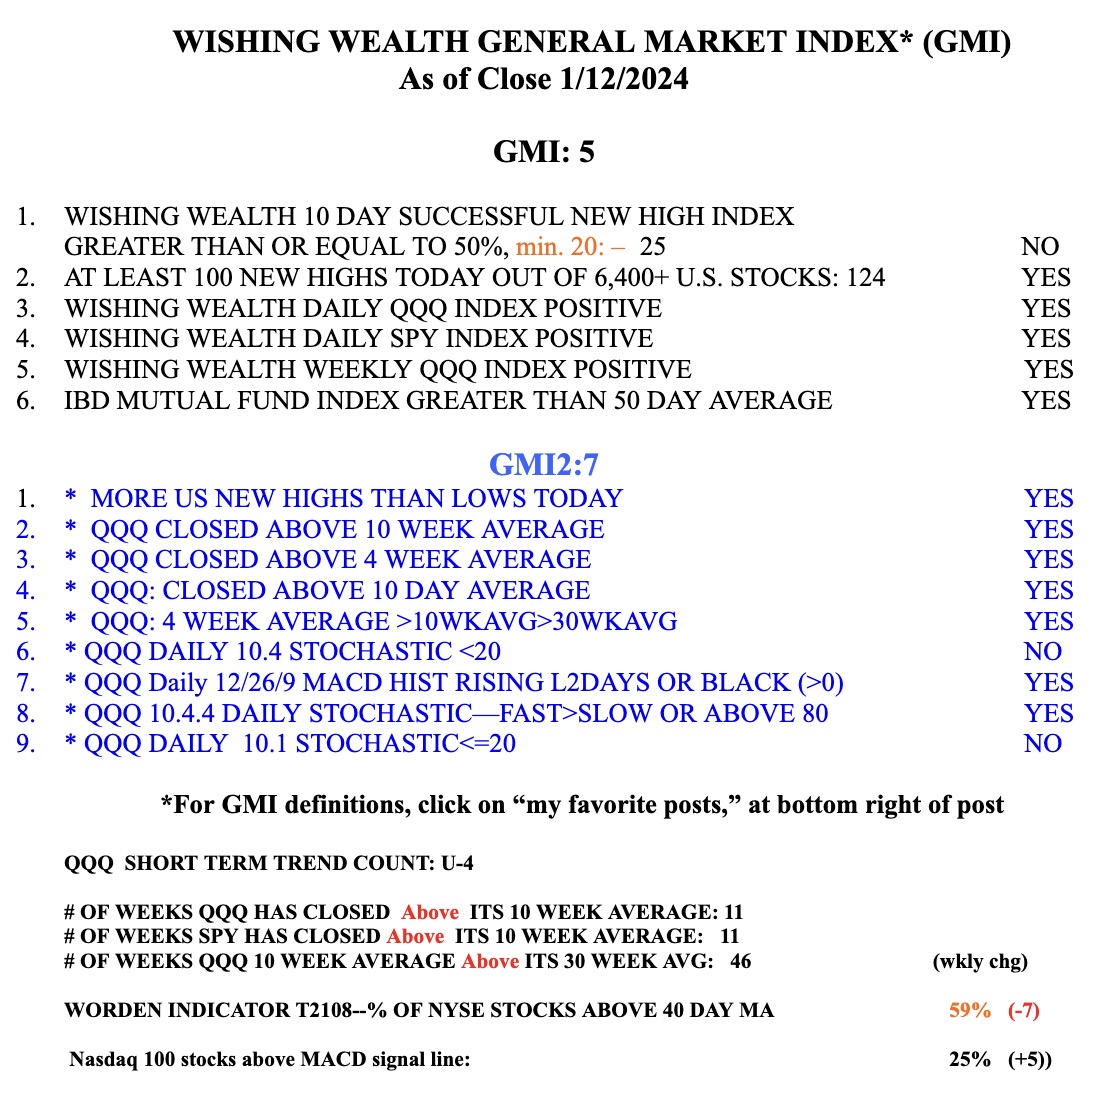
With GMI=6 (of 6) and Green, see table below, and the SPY now above its green line top from January, 2022, the market is in short and longer term up-trends. My QQQ short term indicator signaled a renewed short term up-trend on January 8. I had noted that the market tends to rally during earnings release periods. Since January 8, QQQ is up + 4% and TQQQ is up +11.9%. I began accumulating TQQQ as the short term up-trend developed. Since January 8, only five of the Nasdaq 100 stocks and 6 of the S&P500 stocks have advanced more than TQQQ: For Nasdaq- AMD, PANW, ISRG, NVDA and AVGO. For S&P500 those 5 + JNPR. Thus, as I have shown repeatedly, in a QQQ up-trend TQQQ advances more than 95% of stocks. Why search for the rare needles in the hay stock (5% or less) that can beat TQQQ. I just ride TQQQ. But I do have smaller positions in three of the 6 stocks.
Note in the chart below the blue dot signifying an oversold bounce on January 8, followed by a green dot. The black dots show other indicators of oversold bounces. The green line breakout, GLB, occurred Friday with above average trading volume. Tutorials created for our class by my late valued co-instructor, David McCandlish, show how to add the dots and other indicators to one’s TC2000 charts and can be accessed here. There is a tab on this page for obtaining a small discount for initiating TC2000, which is provided free to my undergraduate class. College students from around the country who are not in my class can receive an academic discount at tc2000.com/academic.