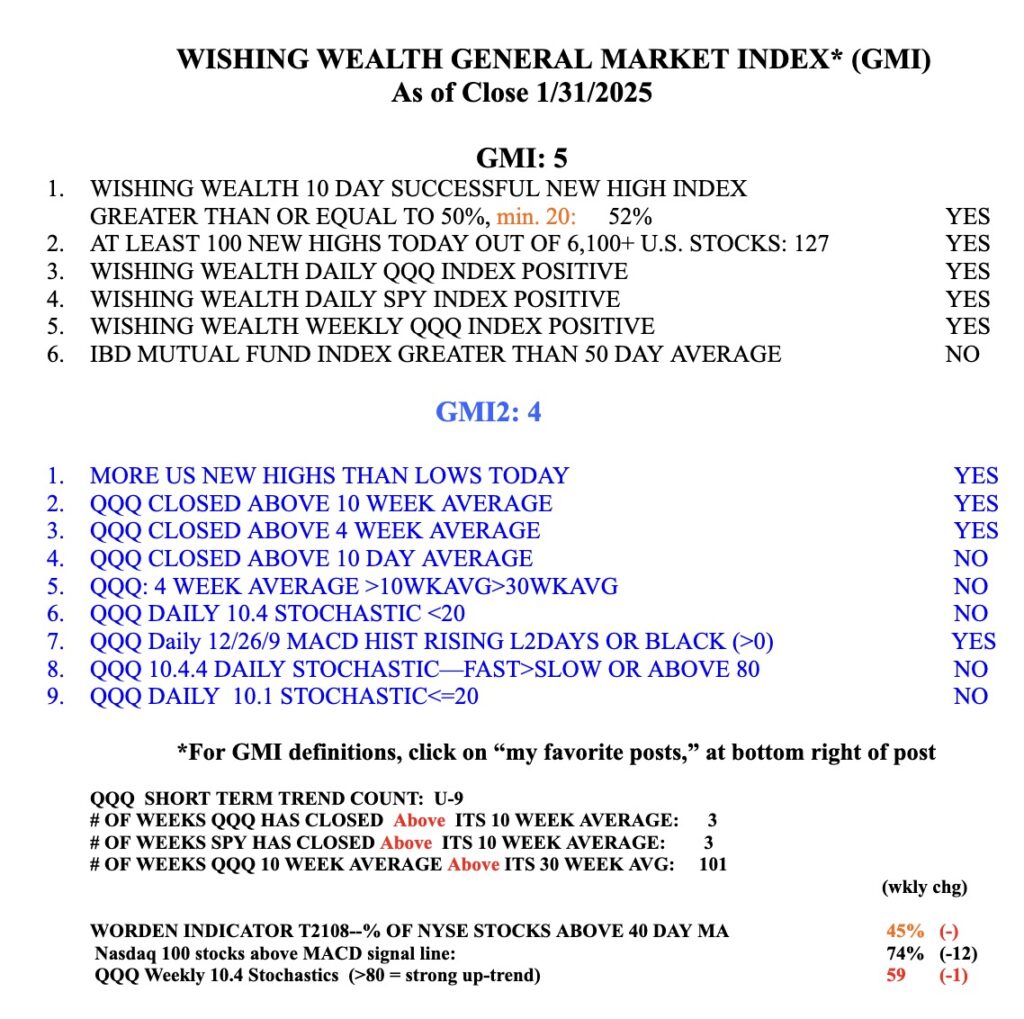
General Market Index (GMI) table
Blog Post: Day 4 of $QQQ short term up-trend and GMI remains Green; $NNE had a high volume recent IPO GLB, see weekly and daily charts
NNE, which came public in 2024, had a GLB to an ATH on high volume last week. See the weekly and daily charts. Its RS=99 but it has no earnings. It is in the hot nuclear energy sector and is worth researching. Someone knows something to result in such high volume buying.


The GMI=5 and remains on a Green signal. SPY and QQQ are above their 10 week averages.
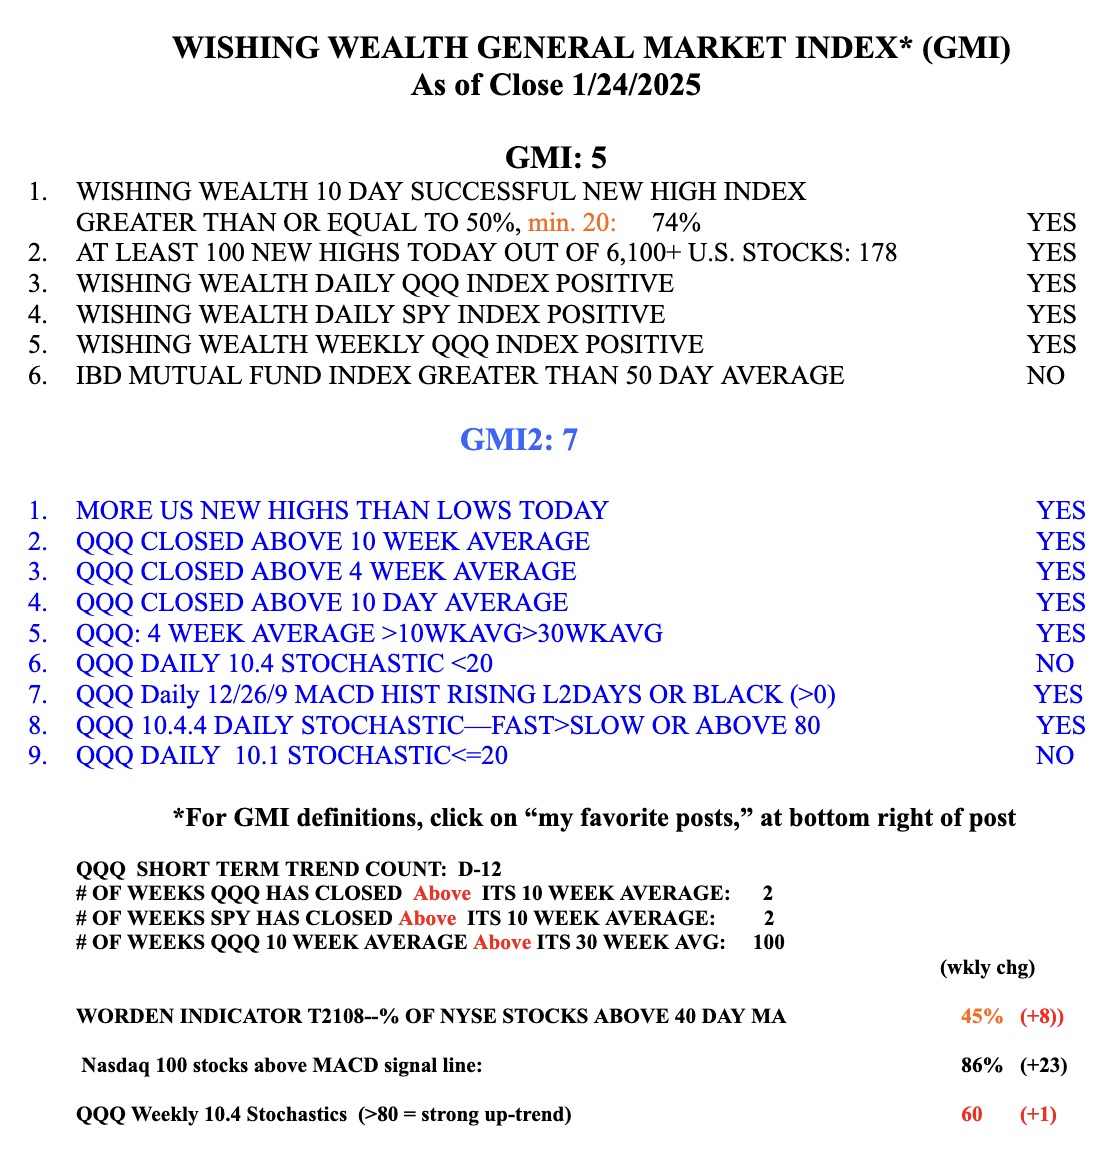
Blog Post: Day 12 of $QQQ short term down-trend; but it could end Monday and the GMI could also flash Green; On Friday there were 128 US new highs, 11 lows and 48 at ATH; $VITL is approaching GLB; Back from Mark Minervini’s exciting 60th Birthday Gala
I spent Saturday and Sunday at Mark’s tremendous Gala and 60th birthday party. I met hundreds of wonderful people enrolled in Mark’s programs and I spoke on the green line break-out (GLB) strategy. Attendees were excited to hear how I developed the GLB and apply it. I was very grateful for their warmm response. Friday’s program had presentations by Mark and others who had made tremendous trading gains using Mark’s strategies. Stan Weinstein also presented! It was wonderful to meet the originator of Stage Analysis. Stan and others were concerned that after 2 great years, the market was likely extended and due for a rest. The Magnificent 7 stocks that have dominated the market indexes reminded him and me of the Nifty 50 stocks of the 70s. It was said that widows and orphans could buy these stocks and never should sell them. And then in the bear market of 1974 the Nifty 50 were decimated. Will that happen to the Magnificent 7? No one knows, but I will not marry any of them.
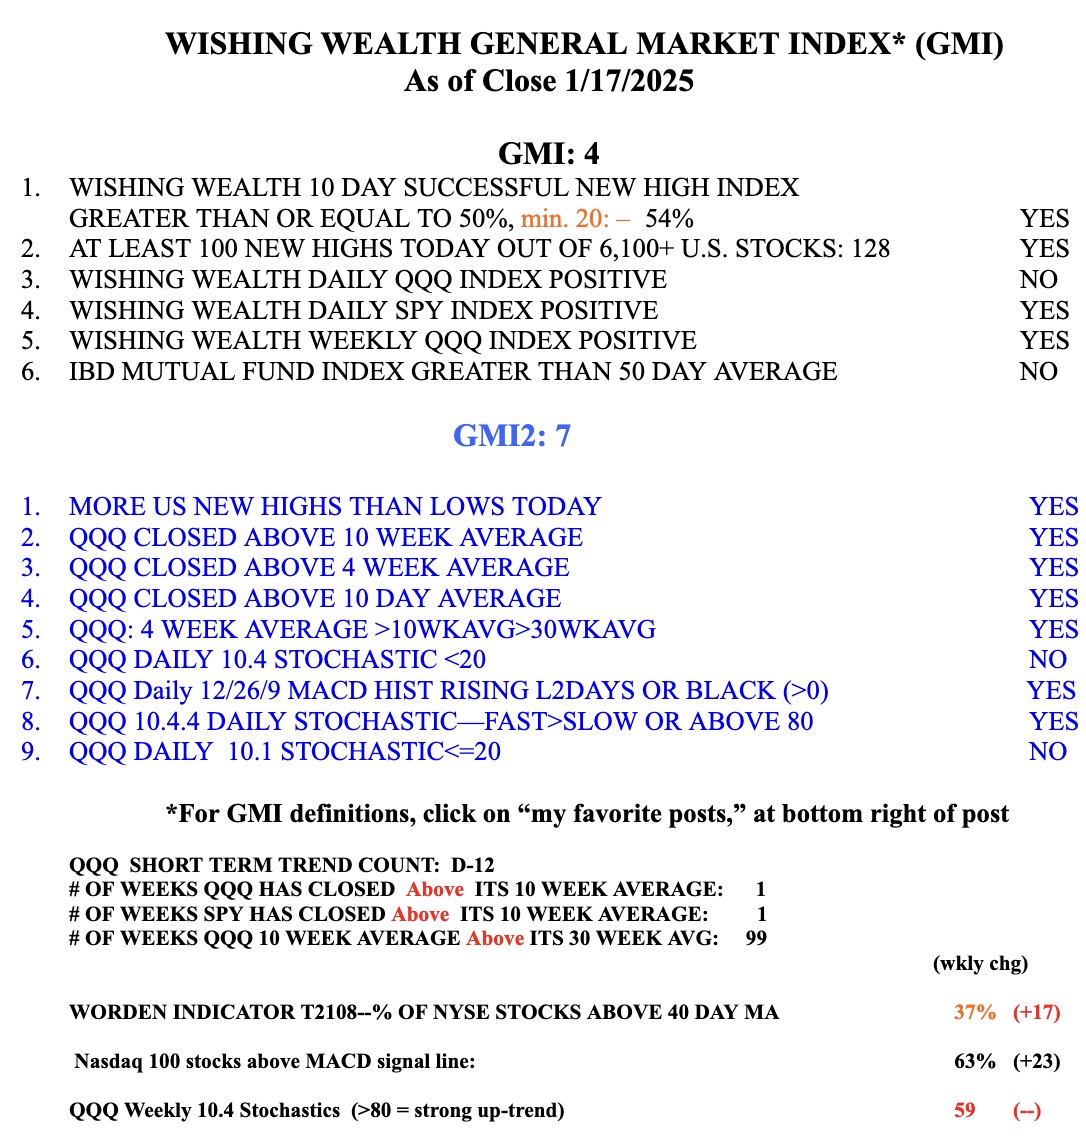
While the market may be extended, the GMI has now turned 4 and could turn Green by Monday’s close. It is important not to marry a scenario and to remain flexible and ready to respond to what Mr. Market does. So I remain open to the possibility that the recent weakness is ending and a new $QQQ short term up-trend could begin. If it does, I will grit my teeth and begin to accumulate $TQQQ very slowly, always at higher levels. The analyses I have posted over the years have shown repeatedly that in a significant advance in QQQ, TQQQ rises about 3x as much and beats more than 90% of all individual stocks. Why try to find the rare needle in a haystack that can beat TQQQ? Stay tuned… Below is an example of a stock approaching a GLB.
$VITL is nearing its green line, at 48.41. I put in an alert to tell me if it trades at 48.42. VITL has already tripled the past year and has an IBD/MS composite rating= 99. I never anticipate a break-out but wait for the break-out to happen. If VITL can CLOSE above 48.41 it will be a GLB. If I buy it, I will sell immediately if it closes back below the green line. This weekly chart shows above average volume last week and a possible cup and handle pattern. New users can sign up on this post to receive my blog automatically.
