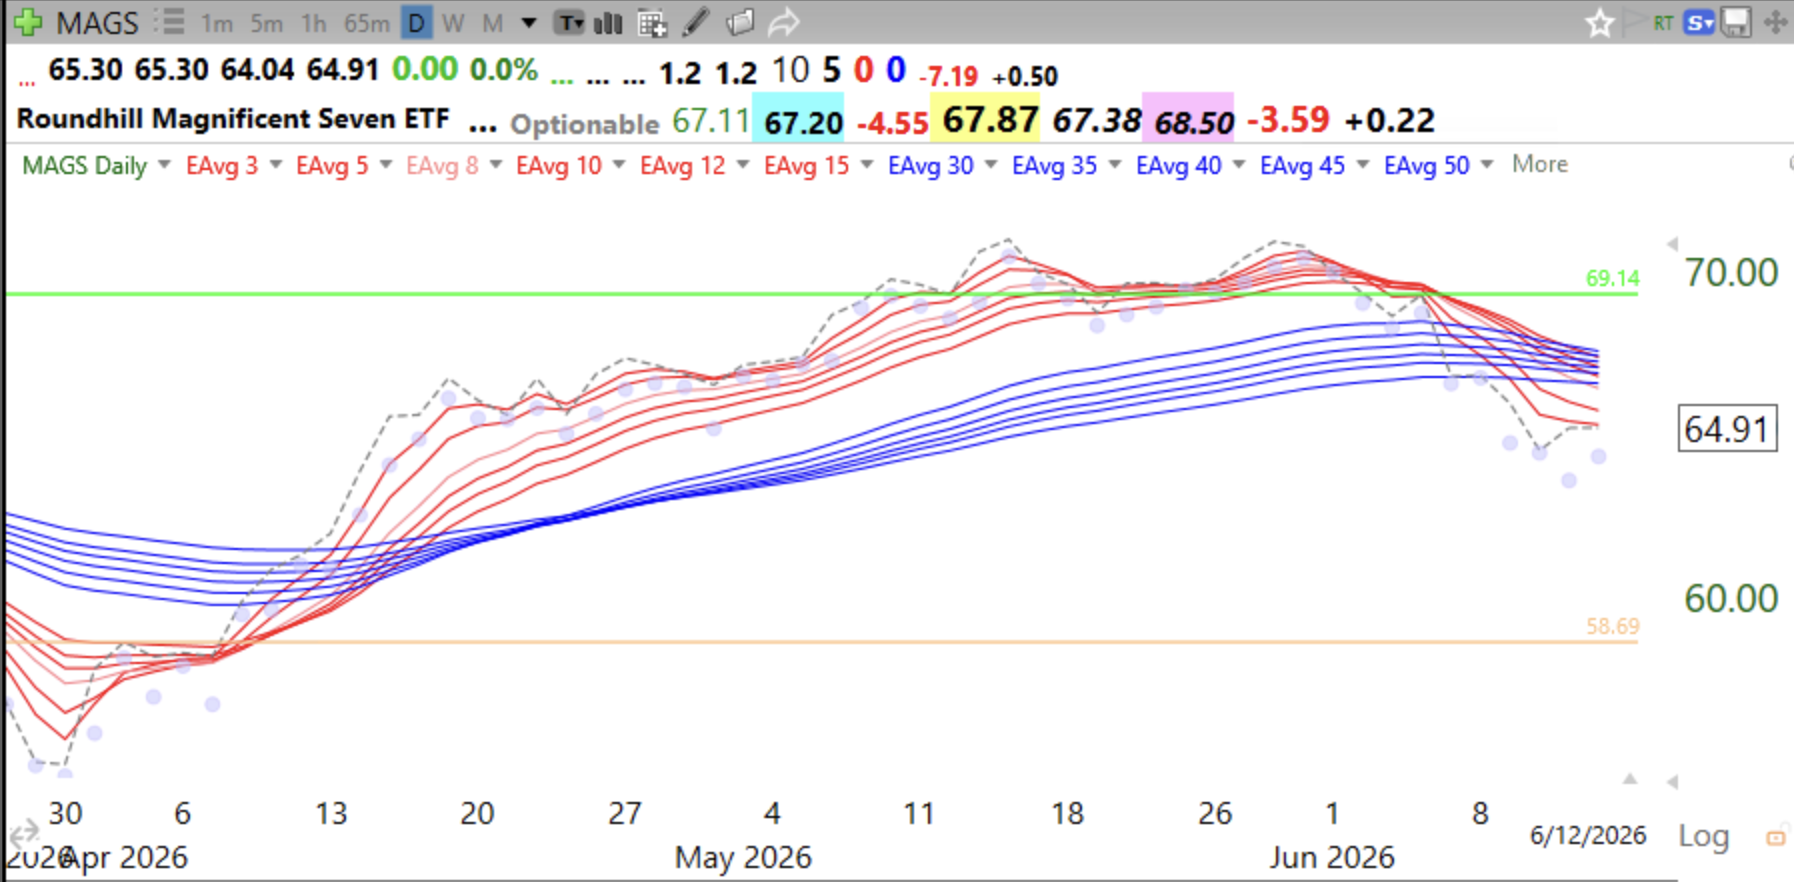
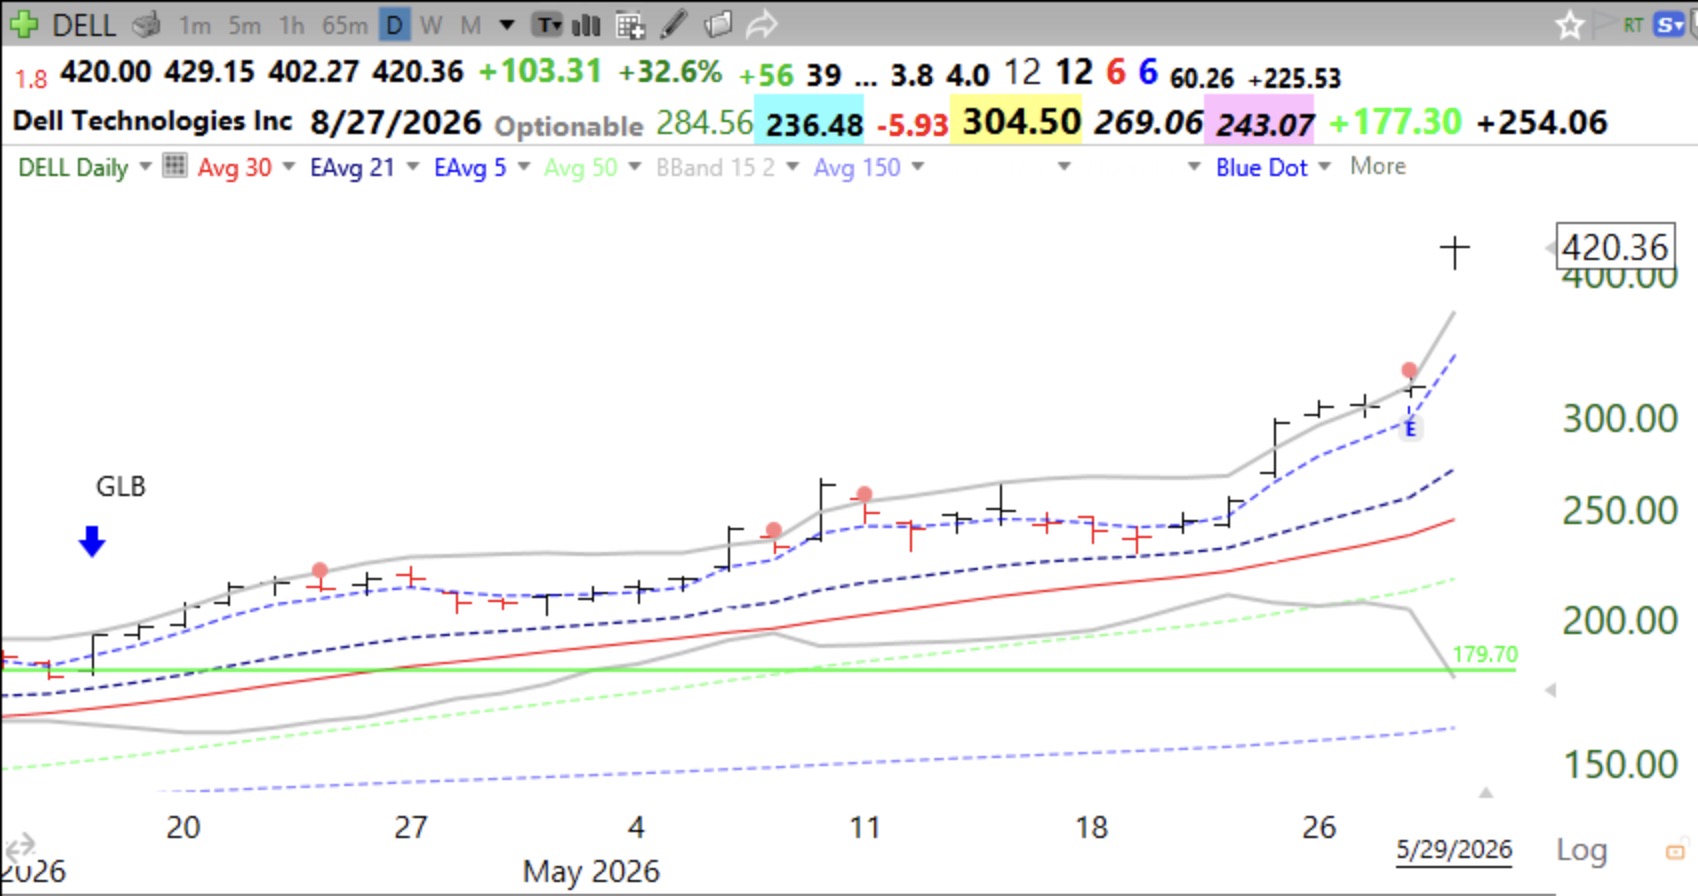
I am back from a short trip. During that time the QQQ short term up-trend ended after 43 days, then began a 2 day down-trend and then started a new up-trend on Friday. As difficult as it is for me to accept, my instruments are strongly positive. I fly by instrument. It is time to be invested long and I may buy a little TQQQ. By the way, the Mag 7 stocks do not look strong. Their daily RWB up-trend is over, see chart.
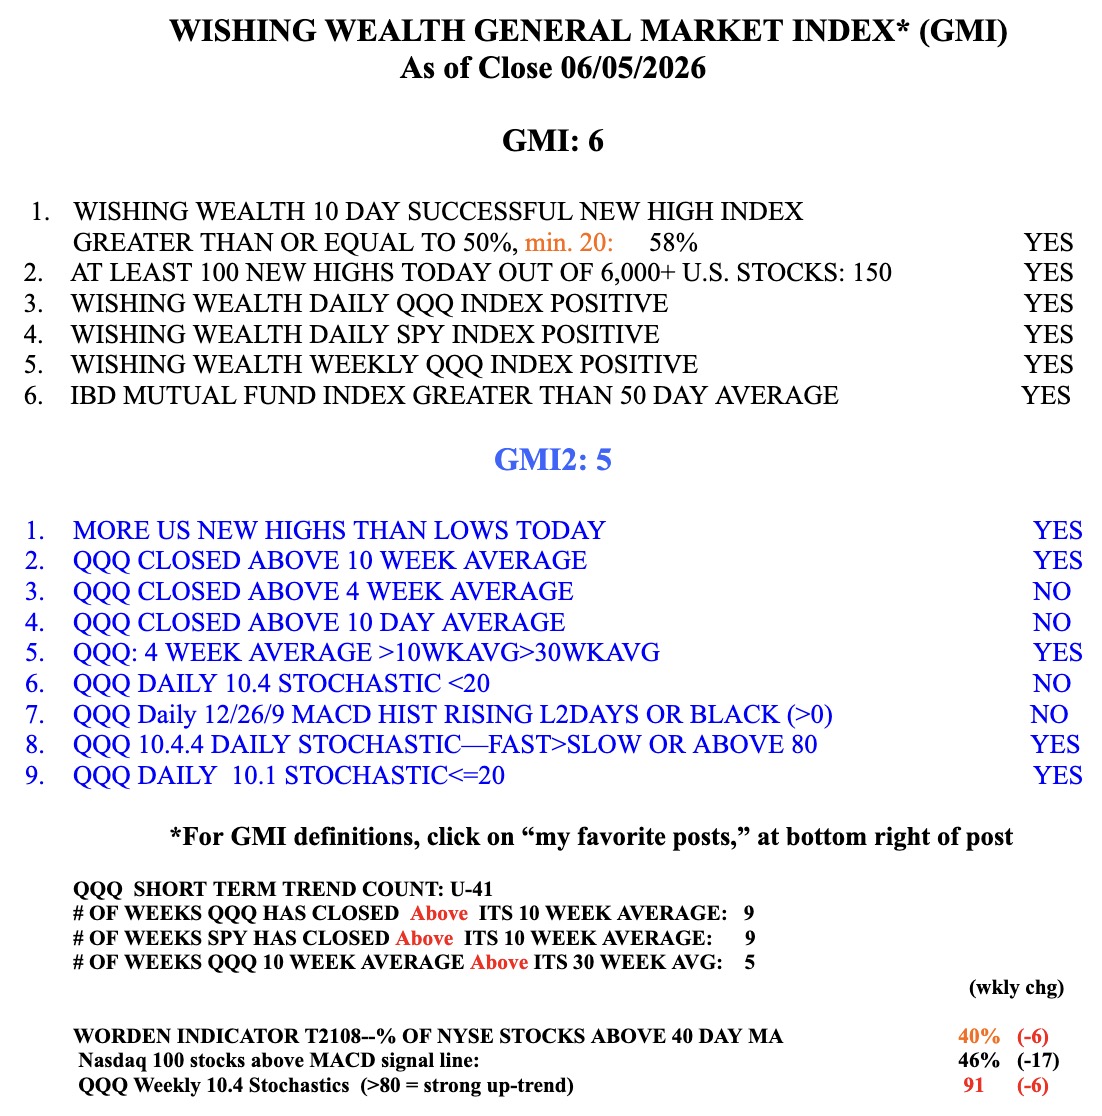
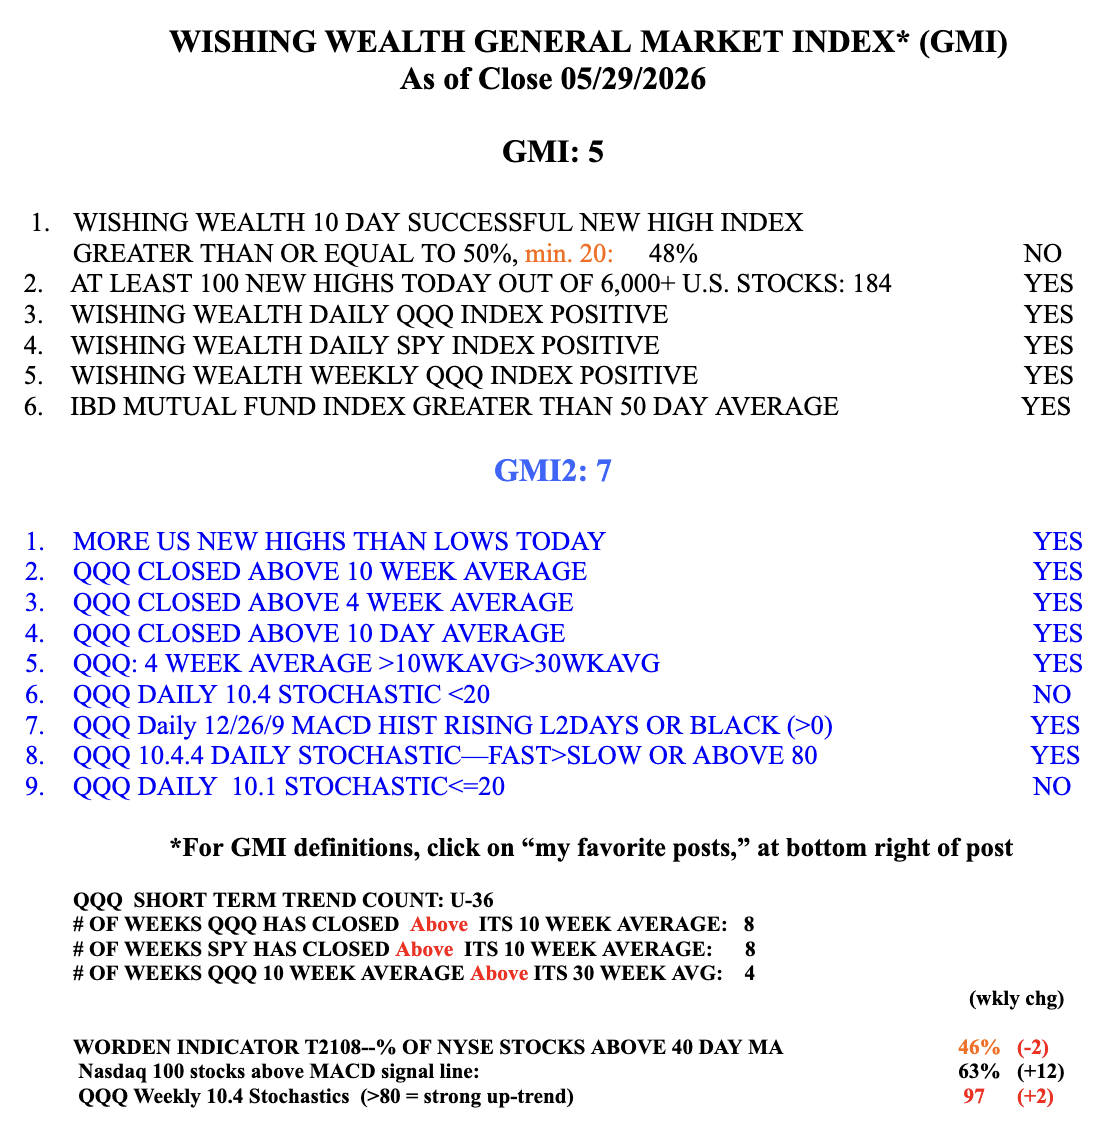
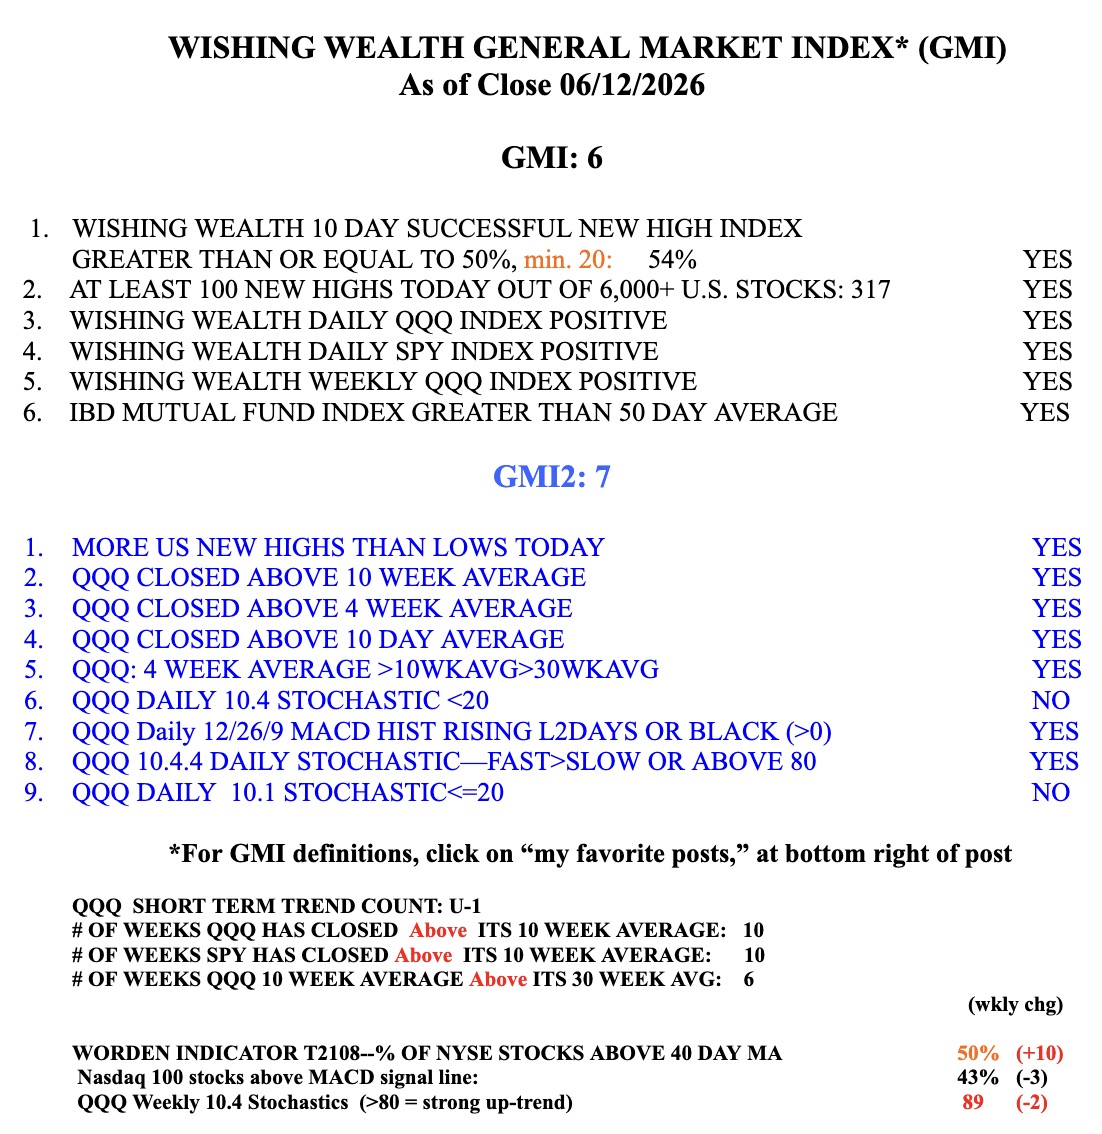
Here is the GMI table.
The MAGS no longer has a daily RWB up-trend. The ETF closed below all of the 12 daily averages.