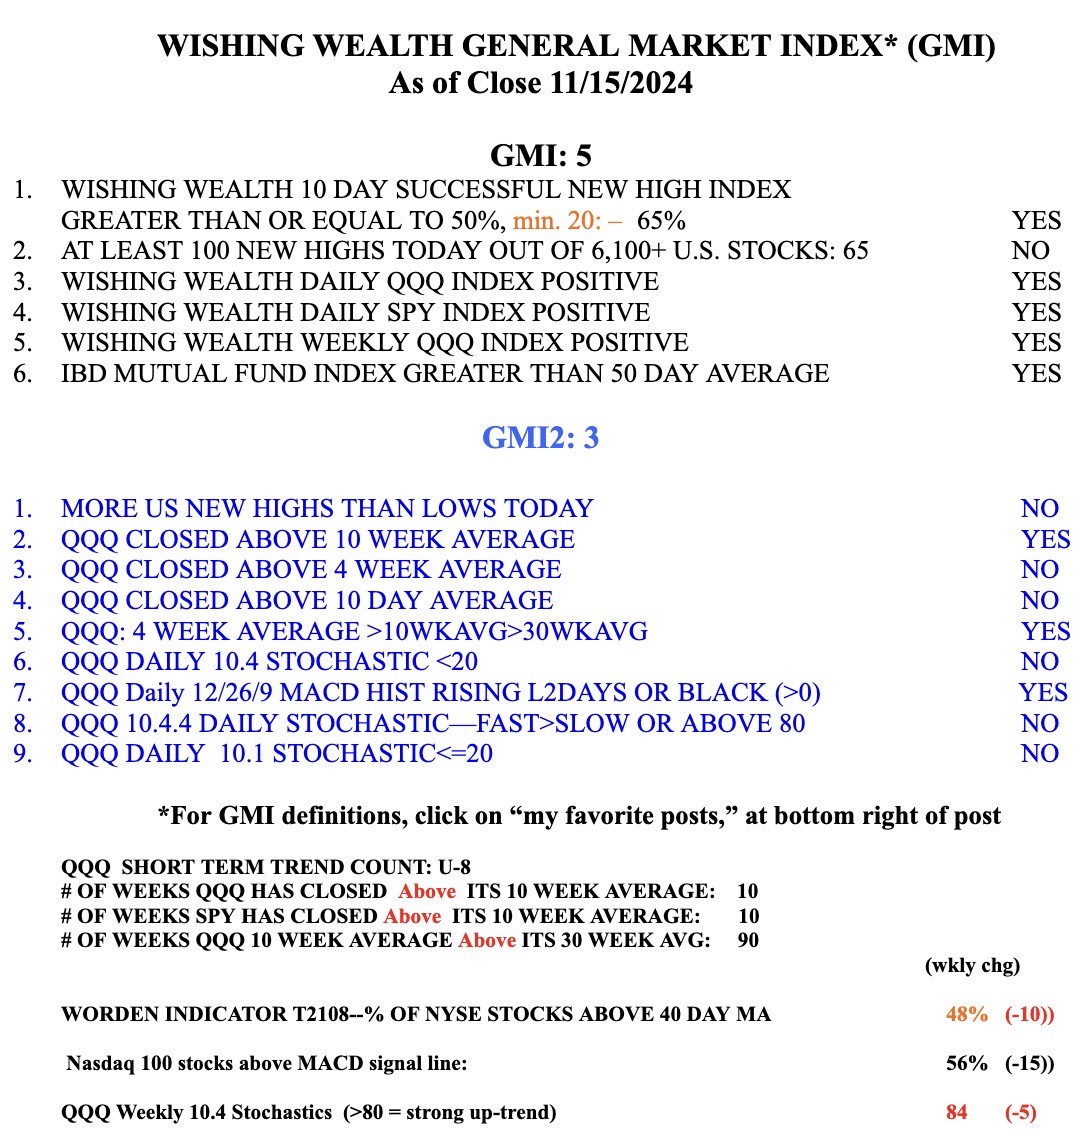
While my short term QQQ trend indicator might turn down on Monday, QQQ closed (gray line) above it 10 week average (dotted line)and its 10 week average is climbing above its rising 30 week average (red line).

Stock Market Technical Indicators & Analysis
While my short term QQQ trend indicator might turn down on Monday, QQQ closed (gray line) above it 10 week average (dotted line)and its 10 week average is climbing above its rising 30 week average (red line).
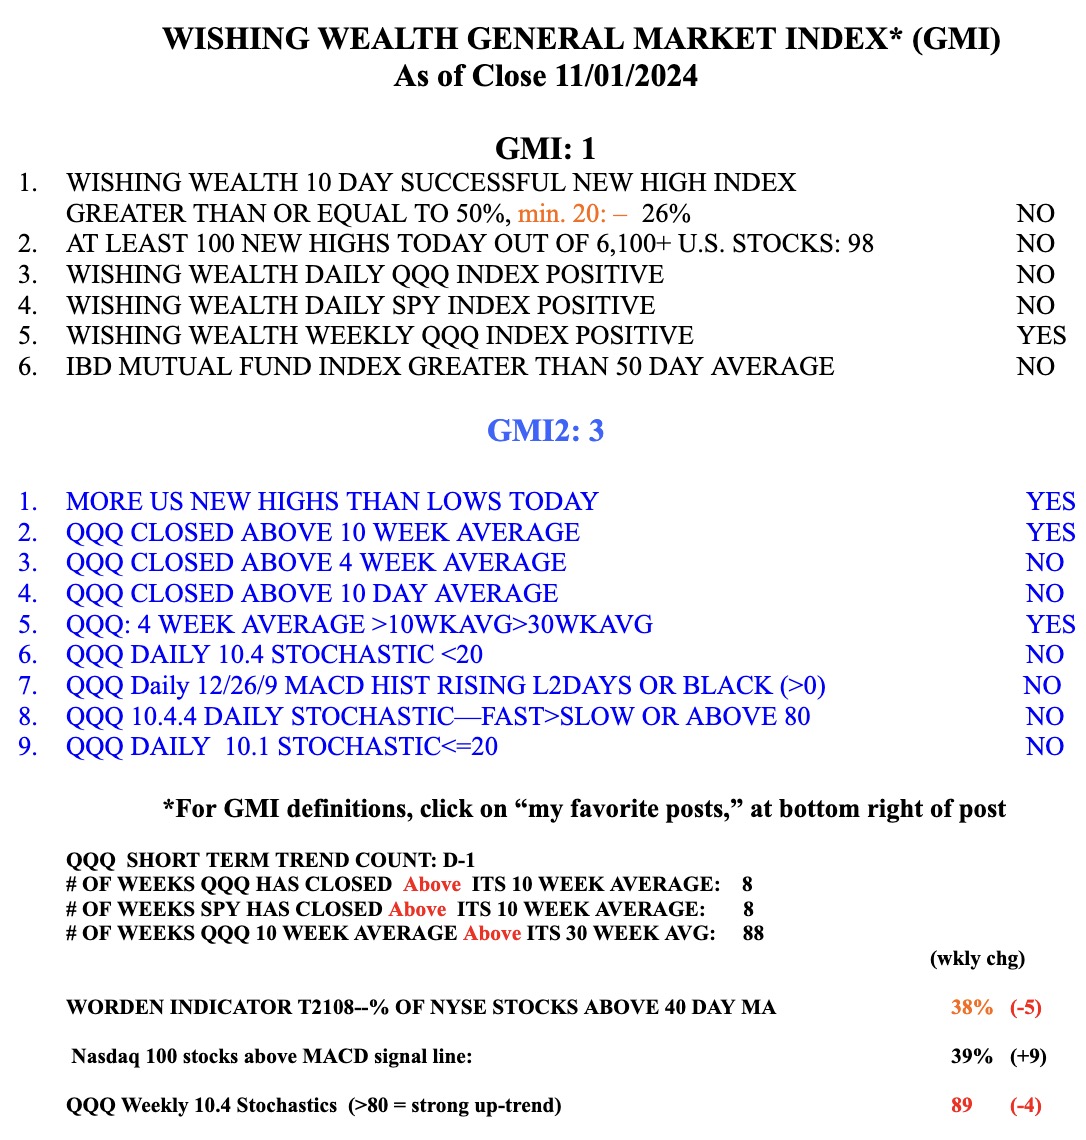
Next week we have an election and the Fed’s decision on interest rates. My indictors weakened substantially last week. I am in cash and TBIL in my trading accounts. TBIL is an ETF that holds 1-3 month treasury bills. The pundits do not agree on the market’s near term direction. As the saying goes, you could line up all economists in the world end to end and they still would never reach a conclusion. Rather than focus on opinions, I focus on the action of the market. So now, things are weak.