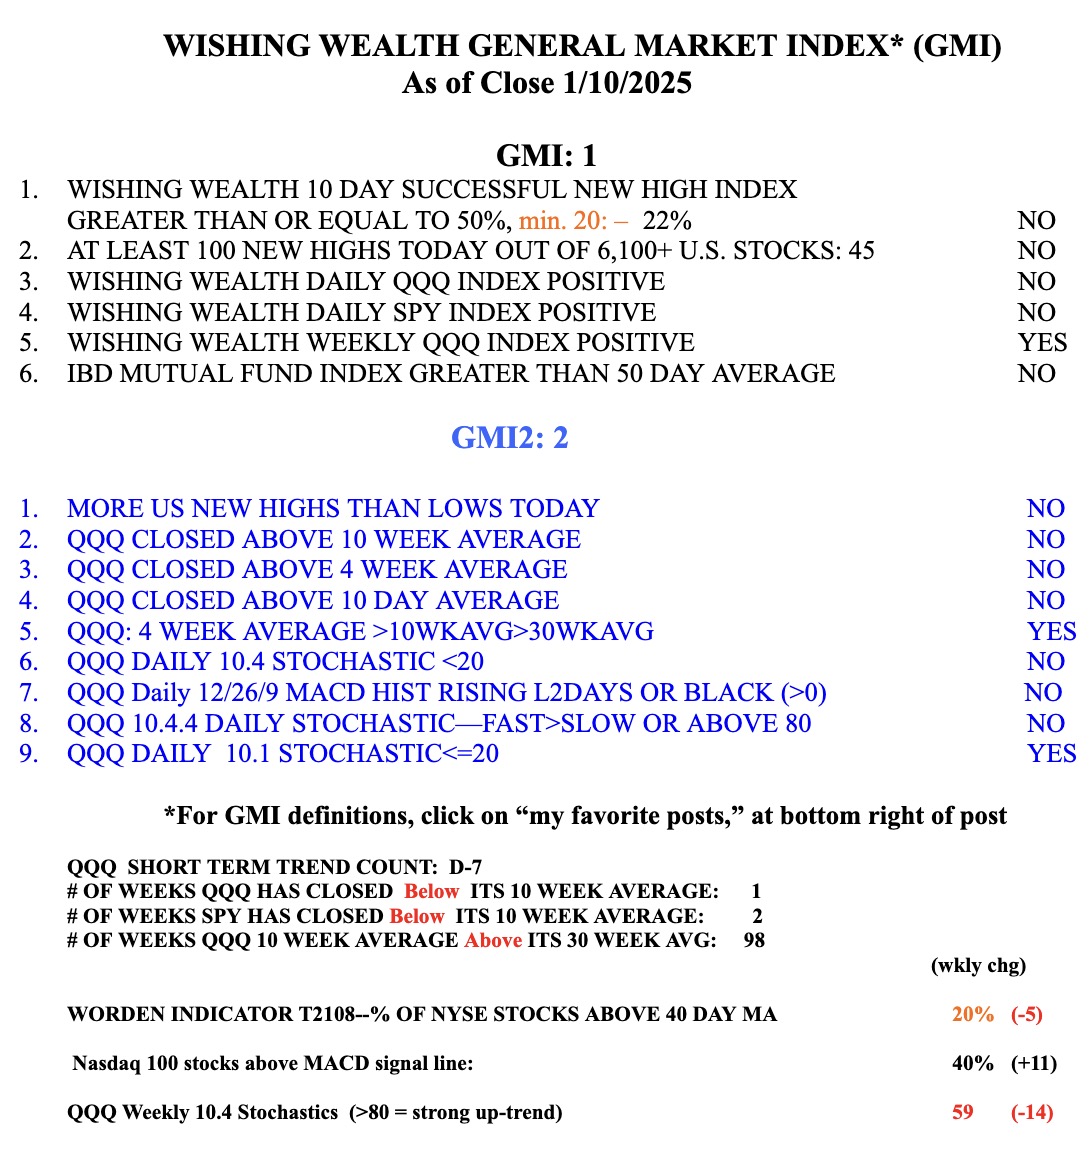
Blog Post: Day 30 of $QQQ short term up-trend; If one had bought $TQQQ on Day 1 of the $QQQ short term up-trend (on 4/28/23) and held it, by Friday it had advanced 29.6% and would have beaten all but 6 of the Nasdaq 100 stocks, see my analysis and a list of the few that beat it

GMI6/6
GMI-27/9
T210859%

If one can ride a sustained up-trend in the QQQ with TQQQ, it is possible to beat almost all other stocks. From day one of the QQQ short term up-trend that I announced on 4/28, TQQQ has advanced 29.6%. Only six of the Nasdaq 100 stocks did better. See this list, ranked by performance from 4/28 through Friday’s close. Did you buy any of them on 4/28?

If you could have successfully picked these 6 stocks on 4/28, then just ignore this strategy and maybe tell the rest of us how you do it. For most mortals, however,  it is much easier to just buy TQQQ than to try to find the needle in the haystack that will outperform it. TQQQ also advanced more than all but 5 of the S&P500 stocks, shown below. In other words, TQQQ outperformed 99% of the S&P 500 stocks. I looked at my Market Smith Growth 250 watchlist from 4/13/2023, the watchlist closest to 4/28 that I have,  and found that TQQQ even beat more than 90% of those promising stocks.

The moral of the story is this. Buy TQQQ instead of trying to predict in advance the small percentage of stocks that will beat it. Please keep in mind that TQQQ is triple leveraged and moves 3x as fast as QQQ,  up or down. So one must have a valid indicator of the short term trend and know when to exit. I post my QQQ short term trend count almost every time I publish my blog and weekly in the GMI table below. (You can sign up to get my blog post by email, lower on this page.) This strategy has worked best if one buys TQQQ on Day one of a new short term up-trend and then pyramid up slowly. This is difficult to do  psychologically because on Day one, by definition, the market trend is reversing from a down trend and it is often hard to believe a real change is occurring.  The key is to start small on Day one and only add more TQQQ as the up-trend develops. If the new up-trend fails, I exit immediately. The media pundits who decry the triple leveraged ETFs just do not understand how well they work in sustained moves. SOXL advanced 57% during this period! While my TQQQ strategy has worked many times, past performance does not guarantee future performance, and be careful.

The GMI remains Green and is at 6 (of 6). I have been reinvesting my pension funds in mutual funds. At some point many of the people who withdrew from stocks in order to earn a “safe” 5% in their savings accounts will panic and race back into stocks at higher prices, when yields decline. So goes the game…..


Blog Post: Day 25 of $QQQ short term up-trend; GMI=6 (of 6) and Green; Market in solid up-trend, set-ups working, $PANW, after recent GLB, to open up strong on Monday, see daily, weekly and monthly charts for green line signals; see list of 23 stocks at ATH

GMI6/6
GMI-27/9
T210853%

PANW kept coming up in my ATH scans. It had a GLB to a new ATH  on May 26. It finally closed above its green line of $213.61 on Thursday, June 1. I bought some on Friday. Friday evening it was announced that PANW will be added to the S&P500 index and the stock has taken off during the after market. Funds and ETFs that mimic the S&P500 index must now buy PANW. My reason for illustrating this trade is to let you know that a stock’s strong behavior often occurs before the news is out. Insiders may have been buying PANW prior to the announcement and their buying caused the stock to have a green line breakout, GLB, to an ATH. The huge up volume day was after recent earnings were released. When an earnings release is followed by a large gap up it can be the beginning of a significant move up. Nicolas Darvas wrote years ago that the atypical volume in a rising stock often enabled him to get on board with the insiders who knew good news was coming. A stock’s and the market’s behaviors are the things to watch. Here are the daily, weekly and monthly charts for PANW. On the monthly you can see all of the green lines drawn in. I draw a green line on a monthly chart at the highest bar that is not exceeded for at least 3 more bars (3 months). I am looking for stocks that reach an ATH, rest for at least 3 months and then break out (GLB) to close above their former peak price.

I have written that I am reinvesting in the market. My trend indicators are strong and many stocks are moving up. Here are 23 stocks on my recent IBD/MS lists that reached an ATH on Friday. They are sorted by the last column, which shows the close Friday/lowest close the past 250 days. Seven have already doubled their yearly lows. I own a few of these stocks.

Blog Post: Day 21 of $QQQ short term up-trend; $NVDA has GLB last week, see monthly and daily charts

GMI4/6
GMI-26/9
T210837%

This monthly chart shows that NVDA had a green line break-out (GLB) to an ATH last week. This is one fallen angel that made it back.

Here is its daily chart. Note the huge volume on the day of the break-out after earnings were released. To avoid being a failed GLB, NVDA should not close back below its green line, at 346.47.


The GMI remains Green, at 4 (of 6).