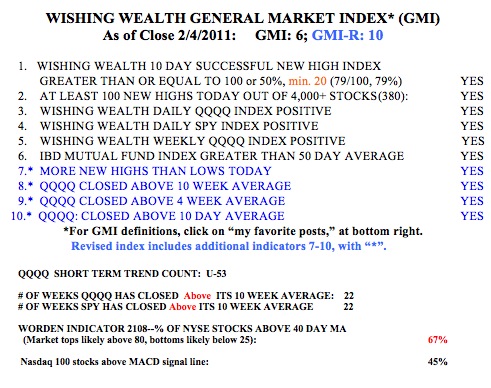
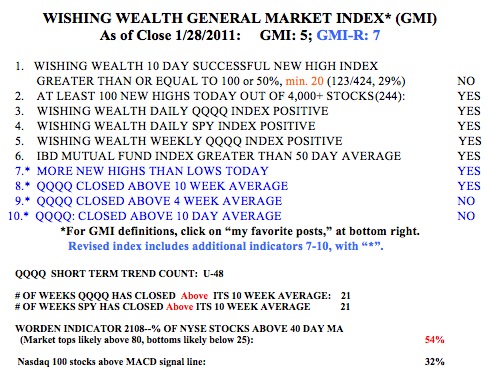
As my regular readers know, each Monday morning I post a table containing the components of my General Market Indicator (GMI) and my revised GMI-R. These indicators track short and long trends in the market and keep me on the right side of the trend. All of the major traders I respect (Darvas, Livermore, O’Neil) talk about the importance of the trend in the general market indexes in determining their success. Most stocks rise or fall consistent with the market trend. So half the battle for profits can be achieved if we track the market averages. This table shows that the GMI and GMI-R remain at their maximum levels. The QQQQ and SPY have closed above their critical 10 week averages for 23 straight weeks. This has been a huge up-trend. When will it end? No one knows for sure. It could end when we get to May (“sell in May and go away“) or it might be some major event like the inability of the president and congress to agree on a new federal budget, with a resulting shut down of the federal government. 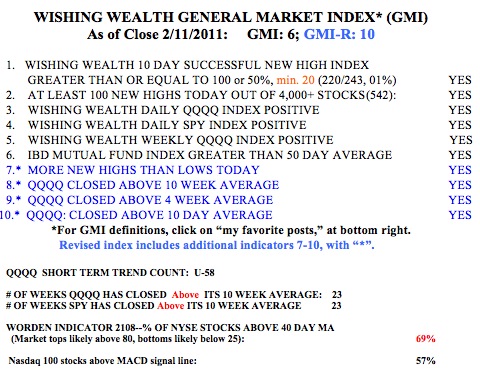
I am a chicken when it comes to investing and often exit too early from the market. I did so a few weeks ago when I read all of the news about an impending municipal bond default. This debacle might occur, but probably when we least expect it. The GMI only tells me the current trend. It will signal a down-trend only after it has begun. So, the proper course for me is to remain on the long side, with one eye always on the exits.
The T2108 remains in neutral territory, at 69%. 57% of the Nasdaq 100 stocks closed with their MACD above its signal line, a sign of short term strength. There were 542 new 52 week highs in my universe of 4,000 stocks on Friday, the most since 685 on January 3rd. The short term up-trend in the QQQQ has now lasted for 58 consecutive days. During that time, the QQQQ has gone up +11.4%, the DIA +9.5%, and the SPY +11.2%.
If I had simply bought an ultra long index ETF I would have had spectacular returns without the need to buy individual stocks: QLD +23.9%, TYH +39.9% and TQQQ +37.2%. Only 20% of the Nasdaq 100 stocks rose 20% or more during this period and only 7% rose 30% or more. So why spend time trying to find the few stocks that can beat these ultra index ETF’s? I have come to this conclusion repeatedly over the past few years. The best strategy may be to slowly buy into one of these ultra long index ETFs when the short term trend turns up and to slowly wade into the inverse ultra ETF’s (QID, TYP, SQQQ) when the trend turns down…..
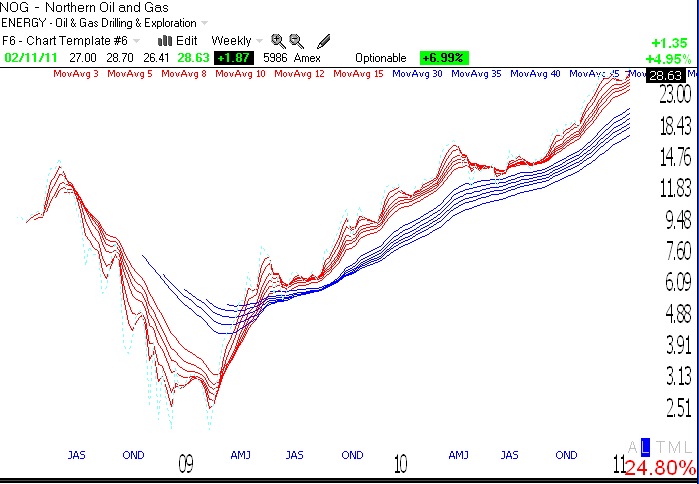
But I can’t resist looking for promising stocks! I did a scan of Monday’s IBD 50 list and found 5 stocks that were bouncing off of support: NOG, MELI, COH, EZPW and LYB. One of them, NOG, may have broken out of a cup-with-handle base on Friday. It closed above its pivot point in the handle (horizontal red line) on above average volume. According to William O’Neil, if one buys a successful stock emerging from a good base at the perfect time, it rarely declines 8%. Therefore, if one purchased this stock at the correct pivot point at about $28.15) one would place a protective sell stop (GTC, good-til-canceled) around $25.89. David Ryan, O’Neil’s successful protege, wrote that he would often set a sell stop even closer to his purchase price. NOG closed at $28.63 on Friday. If I bought it on Monday, I would probably place a stop at $27.49, just below Friday’s low price.
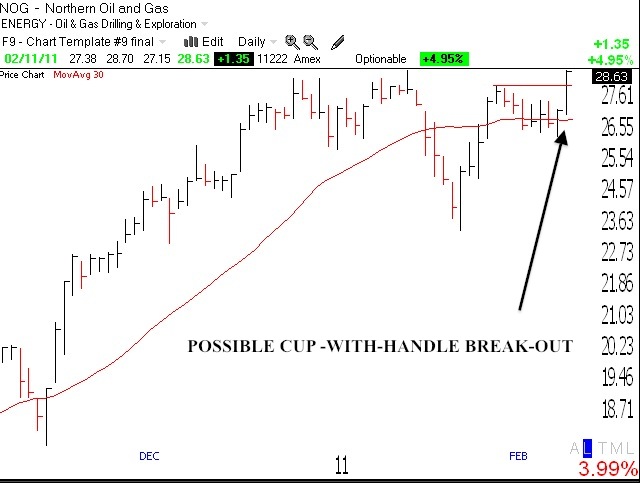
As the weekly GMMA chart below shows, NOG is also am RWB rocket stock at its all-time high, with all of its short term averages (red) well above their rising long term averages (blue lines).