I have thought all weekend about what I should post Monday morning. Everyone is trying to predict what will happen on Monday. That is not my game. No one knows what will happen and surely the media will tout the few persons they are aware of who get it right, simply by luck. With all of the predictions out there, someone has to be right.
So, what do we know right now? First, we now know why the market had so much trouble rebounding from the debt deal mess. Insiders who knew what S&P was about to do unloaded stocks or took up short positions last week. That is the nature of the stock market. This shows the folly of fundamental analysis. Earnings of many companies are good and PE ratios are low, so the fundamentals of the markets are quite good. But that means nothing! PE ratios will probably get even lower this week. It is investor psychology that drives stocks, cycling from extreme optimism and greed to fear and panic. The use of fundamental analysis alone misleads us. Only technical analysis can warn us of a change in trend. As Darvas wrote, it allows us to discern what insiders are doing. I therefore always concentrate on the direction the market is moving.
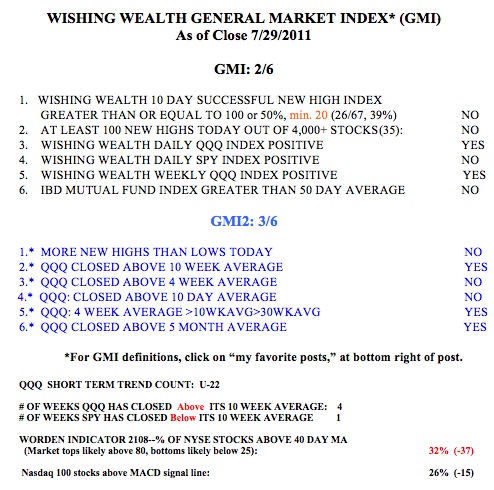
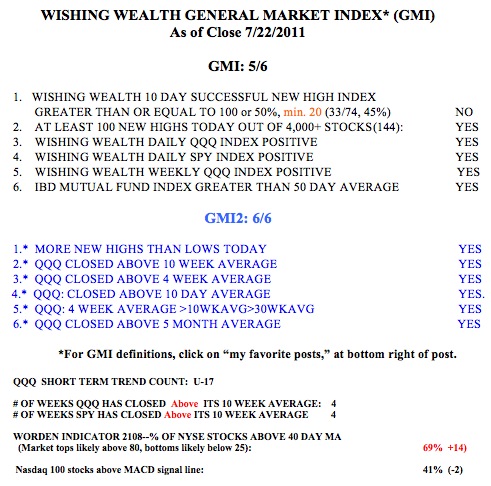
So, my trend indicators as measured by the GMI, have been flashing warning signals. 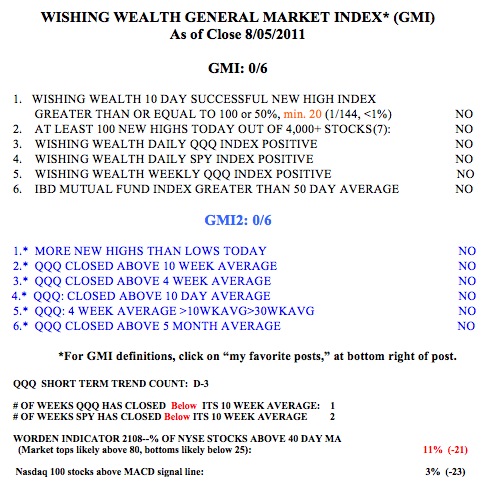 The GMI has been below 4 since July 27. I have written many times that I become defensive when the GMI is below 4. In fact, with the exception of one day since July 27, the GMI has been below 3. For this reason, my IRA and margin accounts are almost 100% in cash. Unfortunately, my university pension is still invested 100% in growth mutual funds–I was afraid to get out again because it would have triggered their market timing rules. I got out too soon a few weeks ago and then got back in. This will be an expensive lesson for me. No one should stay in an investment vehicle that prohibits them from going to cash when they want. That is why exchange traded funds (ETFs) offer investors so much more of an advantage over traditional mutual funds to manage market risk–one can buy or sell them intraday–at will.
So, there are a few technical indicators that concern me. Investment sentiment surveys, at least for last week, are too bullish. We want to see more bears than bulls for a bottom to occur. Most disturbing to me is that my short term trend count for the QQQ is only day 3 of the new down-trend. Down-trends often last for many days. Finally, I have an indicator that has been below 20 at almost all major bear market bottoms, going back to 1933. That indicator is currently around 83. During the quick decline in 1987, that indicator only went to 40, primarily because the market snapped back quickly and did not produce a multi-month decline. So, we are left with the fact that the major equity markets are in down-trends. We do not know how long the decline will last.
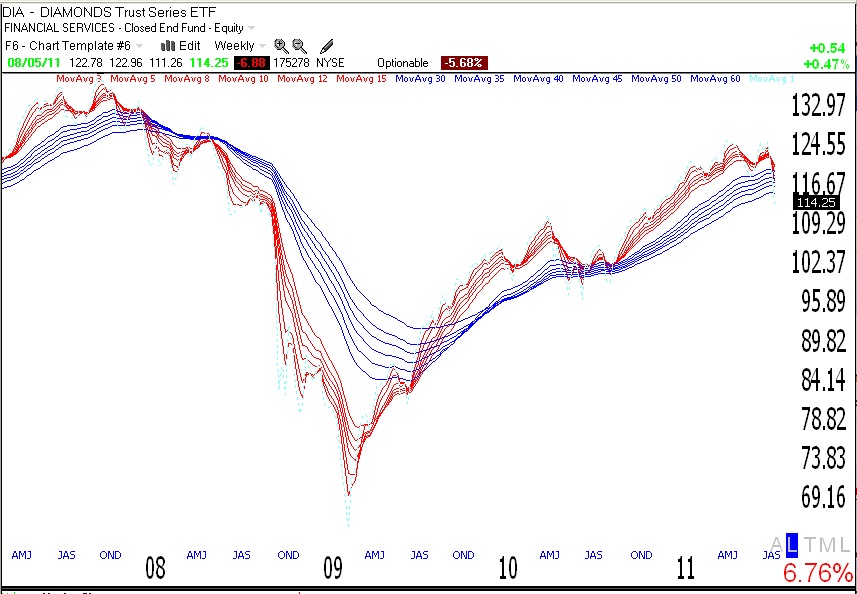
However, the following chart makes me question the strength of this decline. The weekly GMMA chart of the QQQ shown below puts the current decline in perspective; it shows that the shorter term averages (red) remain above the longer term averages (blue), suggesting that we have not yet entered a serious down-trend phase, at least compared with the pattern in 2008. (Click on chart to enlarge.) Thus far, the current decline looks more like the consolidation period we experienced in 2010. A major decline will have the red lines declining below the falling blue lines. Maybe I should not be swept up in the current bearish hysteria.
For those of you who are in cash, good job! Those of us who still own mutual funds have the tough choice of determining how far we want to ride the down-trend. This is a personal decision based on one’s tolerance for risk and one’s personal financial situation. I can tell you that the Worden T2108 is at 11%. In 1987 it reached a low below 1%. In 2001 and in 2002 it got to around 7%, and in 2008, it got close to 1%. So, at 11% the T2108 is in oversold territory, but it could go much lower if this turns into a multi-month decline. This has been a very rapid decline thus far. I will be watching to see if a rebound rally occurs. The strength and duration of any rebound may provide clues to the actions I must take. Furthermore, after every decline has ended, I promise that during the next one I will buy a bullish index ETF (QLD) if the T2108 goes into single digits. Will I have the courage this time?
Be careful and thank you for the nice feedback on my blog. I just talked to my stock buddy, Judy, who urged me to post tonight so that my readers can have the benefit of my thoughts. She thinks it might help them have a balanced perspective on the current situation. I hope it does.