To understand human beings, one must concentrate on their behavior rather than their words. The same goes for the markets. Ignore all of the verbal noise of the media pundits and concentrate on the markets’ actions. And this market appears to be turning around, at least for now. The T2108 is well out of oversold territory and the indexes are crossing above both their long and short term moving averages. All but two of the market leaders I follow are showing signs of strength, including AZO, AMZN, AAPL, GOOG, FFIV, CMG and BIDU. NFLX has been in a down-trend since July and PCLN is flat. The fact that a leader like AAPL can come through the volatility of the past few months within 1% of its all-time high bodes well for tech and growth stocks. I am wading into this market and have a position in AAPL.
The other indicator that is encouraging me to go long is the fact that the Investors Intelligence poll of investment advisers shows about 5% more bears than bulls. This rarely happens and the market often goes up when so many professionals have given up on the market. Yes, we still have to get through that dreaded month of October, but remember that the “sell in May and go away” mantra says to go back into the market around Halloween. I have seen many markets bottom out in October.
When there are only a few stocks hitting 52 week highs, it is easy to go through the list of new highs to look for stocks that may surge higher when the market strengthens. On September 7, I wrote about the technical strength in AZO at $313.83. AZO closed on Friday at $331.25 up 5.5%, but more importantly a rise of over $17. I buy expensive stocks and trade on the point move, not the percentage move, and a 17 point move on one call option = $1700.
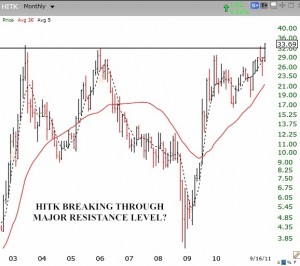
The following stocks showed up on the new high list on Friday, have strong recent quarterly earnings and look technically promising to me: JAZZ, ATHN, DLLR, EVEP, HITK. I will place these on my watch list for potential buys if the market trend continues up. As this monthly chart shows, HITK has just broken through a major resistance level over the past 8 years. Institutions may have stepped up buying of HITK. HITK has a 98 (out of 100) composite rating in IBD and is at or near the top in each IBD group comparison.
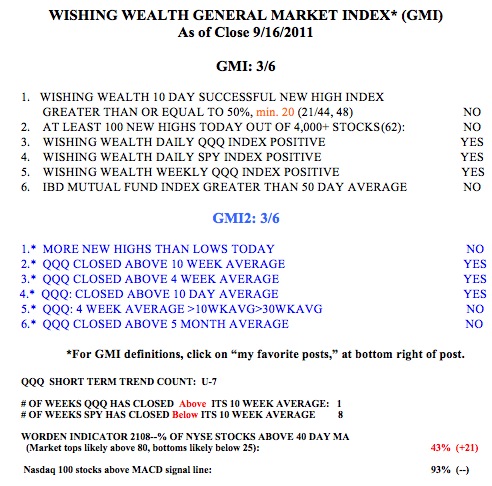
The GMI and GMI-2 are each at 3 (of 6). The last time the GMI was at 3 was August 1. All of my indicators that reflect the indexes’ place in relation to their moving averages are positive. 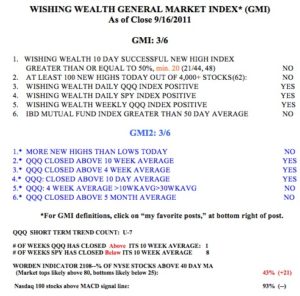 The remaining negative indicators in the GMI will depend on their being a longer up-trend that will show more new highs that continue to move up, and on the performance of the IBD Mutual Fund Index.
If you have a subscription to IBD, take a look at the insightful interview with William O’Neil, the founder of IBD and creator of the CAN SLIM method, posted on Monday’s homepage of the IBD site. He discusses a number of the stocks I have highlighted recently, including AAPL, ALXN and ATHN.
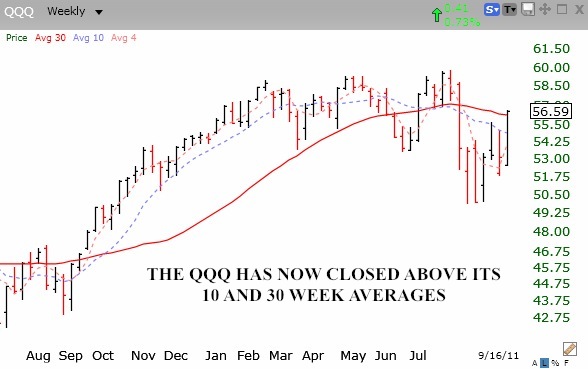
Note that the QQQ is now above its 10 week average and leading the market up, while the SPY, which includes financial stocks, is still bearly (pun intended) below its 10 week average, for the 8th week. I generally can make money trading tech stocks when the QQQ remains above its 10 week average. I am still concerned that its 30 week average (red solid line) is declining, but at least the index is now above that critical average.
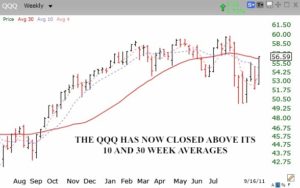
So, I am buying some growth stocks in my speculative accounts. I am considering slowly wading back into the growth mutual fund in stages in my university pension this week, but I prefer the 10 week average (blue dotted line) to be rising. See the pattern at the rise that began in September, 2010. Click on chart to enlarge.
Note that the registration for the Fall 2010 Stock Challenge begins today and is open to honors alumni and all students faculty and staff in the University of Maryland System.
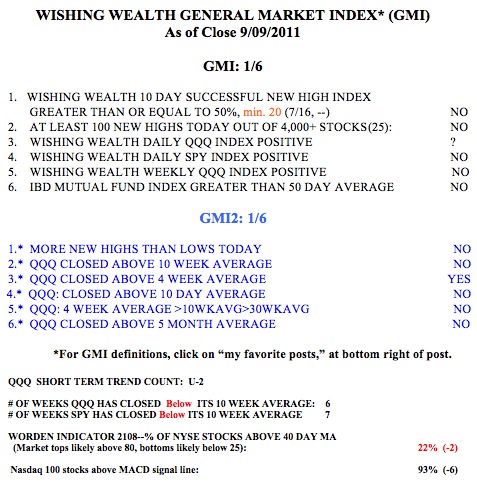
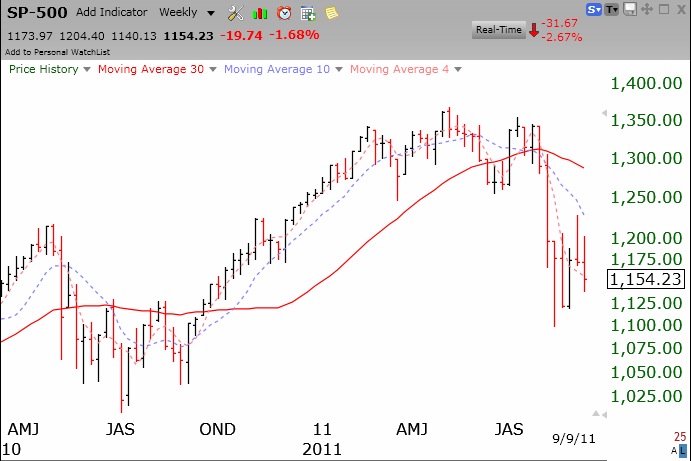
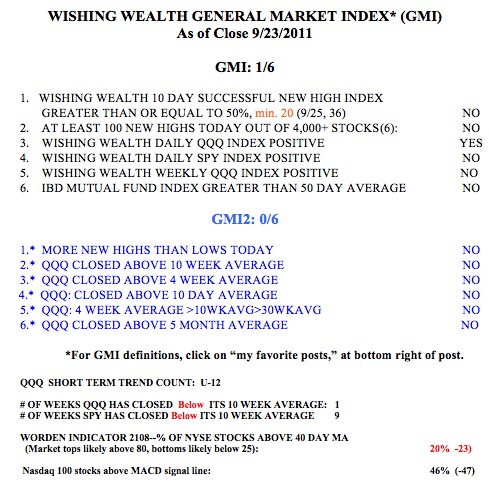 The T2108 is at 20%, in low, neutral territory. The T2108 indicator reached 7%, very oversold, at the August market bottom. Note that the SPY has closed below its 10 week average for 9 weeks but the QQQ for just one week. This reflects the fact that the Nasdaq 100 Index (QQQ), unlike the S&P500 Index (SPY) contains no financial stocks. And as in 2008, the major weakness is showing up in the financial stocks.