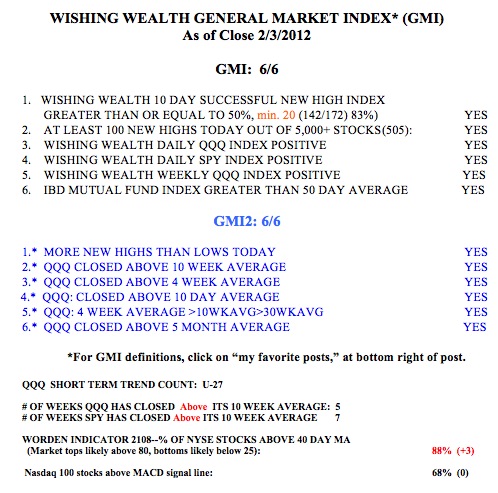
I only ride the yellow band trends! Down-trend, in cash or short; Some possible submarine stocks–GOOG????

Well, the GMI is back to zero and, by my definition,   the QQQQ short term up-trend is now over.   One of the toughest lessons I have learned over the past 40 years is that I should only stay in the market when there is a well defined trend.   What used to happen to me was that I would ride an up-trend to profits only to give back all of my profits and more, as the market entered a decline.   But how to determine when there is a meaningful trend?   After studying past winning stocks, I discovered the “yellow band” pattern that works quite well for individual stocks.   I decided to apply my yellow band approach to the Guppy Multiple Moving Average daily chart of the QQQQ. (Click on chart to enlarge.) The yellow band pattern is present when I can draw a yellow band between   certain short term and longer term moving averages, that are in turn rising or falling together.   Here you can see the yellow band up and down trends that occurred in the QQQQ since late 2009.   It is during yellow band trends that I can usually make money trading consistent with the trend. At the present time, the QQQQ is not in a well defined trend, although it may be starting a new yellow band down-trend.   All of the short term moving averages (black lines) in the chart are now below the longer term averages (red lines), but they are not separated by much.   For me, the odds are presently slim for my trading   long or short positions profitably, until a new yellow band trend materializes.   Just remember, a change in trend can begin at any time.

So, the GMI is back to zero, indicating that my original short and longer term market indicators are all negative. The revised, more sensitive GMI-R is at one, because there were more new highs than lows on Friday in my universe of 4,000 stocks. Friday was the first day in the new QQQQ short term down-trend (D-1). The QQQQ and SPY have remained below their 10 week averages for 8 weeks, so even during the brief, 7 day   short term up-trend that just ended, the longer term weekly trends were weak.   The Worden T2108 Indicator is at 41%, in neutral territory.   And 58% of the NASDAQ100 stocks have their MACD above its signal line, down from 95% last Friday.

I wish I could be more positive about the market’s trend.   But when my indicators are so weak, it makes no sense for me to try to make money by going long stocks.   And yet, the QQQQ short term down-trend is only one day old.   When I get a new down-trend I sometimes buy a little   QID or TYP (ultra short ETF’s) with the idea of selling it if the trend reverses up, or adding to my position if the market decline deepens. The key to trading success is to have many small losses and a few very large gains.

I promised to provide a list of some submarine stocks, stocks that look weak to me by my technical standards.   See the last post on submarines I did when I discussed PWRD, which is down more than 30% since then.   Submarine stocks tend to decline, sometimes greatly,   as long as the market’s tide is going out.   Here are 10 of the 95 stocks that showed up, based on my TC2007 scan of the market after Friday’s close: WDC, TECD, VPRT, ALGT, ATNI, UIS, ATHR, BWLD, SLAB, and most interestingly, GOOG.   These stocks may be forming Stage 4 declines, a la Weinstein (see his book to the lower right).   This is a good watch list for me to   research on such things as sector strength, short interest and other technicals. I hold no short positions in any of these stocks.

Some Stocks Near All-Time highs; Since June 4, IBD100 Stocks 3x more likely to rise 10%+

GMI4/6
GMI-R7/10
T210850%

I often search for new market leaders by scanning stocks that hit new 52 week highs.   This table   (click on to enlarge) shows stocks that hit a new high on Friday,   that are near their all-time highs, and had most recent quarterly earnings increases of   at least +50%.   The first EPS column is the most recent quarter’s earning’s change, followed by the prior quarter’s change, followed by the annual increase in earnings. Next comes P/E ratio, Friday’s close divided by the close one year ago, % change in revenue last quarter, and the P/S (price to sales) ratio.   Of note, all of these stocks had an increase in revenues (sales) last quarter.   As is typical, the majority of these 11 stocks (64%) also have shown up in my past IBD100 or New America stock lists, as shown by the flag (check)   to the left of the symbol.   If this up-trend is for real, some of these stocks may prove to be among the leaders of the new up-trend.   Of course, the next step is to research each stock’s fundamentals and business concept before considering a purchase.

From time to time, I analyze how a recently published IBD100 stock list has performed since its Monday publication.   I examined the list published on Monday,   June 7th and looked at the change in these stocks since their close the preceding Friday (6/4).   From that time through the close on 6/18, I found that 91% of the IBD100 stocks advanced.   The median change was +6.5%, and 21%of the stocks rose 10% or more.   In contrast, during the same period, 90% of the NASDAQ 100 stocks advanced, with a smaller median change of   +4.8%, and with only 8% of the stocks rising 10% or more.   Thus while almost all of the IBD100 and NASDAQ100 stocks rose during this period, the IBD100 stocks were three times more likely to advance 10% or more. In fact, the largest gainer in the NASDAQ100 stocks was WCRX (+13%), while six IBD100 stocks rose from   15% to 24%. These data do not support the often quoted assertion that when a stock appears on the IBD100 list, it is too late to buy. On the other hand, we have shown before that during a market decline, IBD100 type growth stocks tend to fall more quickly than other stocks.

I also looked at the top ten ranked stocks on the IBD100 list published on 6/7. Eight of the ten (80%) have advanced, with the biggest rises occurring in NFLX (+15%),   WPZ (+12%) and DECK (+12%).   The two declines were in DGIT (-<1%) and MED (-4%).   So, some of the top 10 stocks did quite well!

Sometimes it is difficult to grade the components of the GMI.   This week, two of the components received a “?” because they are too close to call.   I therefore kept the total readings the same as Thursday’s, with the GMI at 4 and the GMI-R at 7.   Those of you who prefer a rigid adherence to the criteria can go with readings of   3 and 6, respectively. A strong day on Monday would probably turn the GMI to 5, because we had 99 new highs in my universe of 4,000 stocks on Friday.   Friday was the third day (U-3) of the new QQQQ short term up-trend.   Of note, is that the Worden T2108 Indicator is now at 50%, and once the pendulum moves out of oversold territory, it typically goes back to around 80%.   Also, 95% of the NASDAQ 100 stocks have their MACD above its signal line (a positive histogram), a sign of short term strength.   I would feel more confident of this new up-trend if it can reach day 5 and if the QQQQ’ could rise above its 10 week average.   So, I am holding some long positions, and will add to them if the up-trend continues.   At the beginning of a new up-trend, we often are scared to go long because we are driving along, looking through the rear view mirror at the recently ended decline…..

Market still in down-trend; Bear market on the horizon?

GMI1/6
GMI-R4/10
T210825%

The GMI has moved up to 1 (of 6), because the 10 Day Successful New High Index turned positive, and the GMI-R is at 4 (of 10), reflecting the strength in my very short term trend indicators.   The Worden T2108 is now out of bottom territory, at 25%.   The number of NASDAQ 100 stocks with their MACD above its signal line is now up to 70%, indicating short term strength.   Still, Friday was the 27th day of the current short term down-trend in the QQQQ (D-27), and the QQQQ and SPY have closed below their key 10 week averages for six weeks. I cannot trade profitably on the long side when the key indexes are below their 10 week averages.

There is a very interesting article in Barron’s online about the strong likelihood we are entering a bear market. When a big publication like Barron’s has the courage to publish such a bearish article, it   sometimes serves as a good contrary indicator.   So it   makes me stop and question whether I should get on the bear bandwagon.   Right now it is important to respect the current down-trend and to try not to anticipate a change in trend.   When a real change occurs, I will have plenty of time to jump on board.     I am therefore content to wait for my indicators to detect any turn. I remain mainly in cash, holding some GLD and a few shorts.