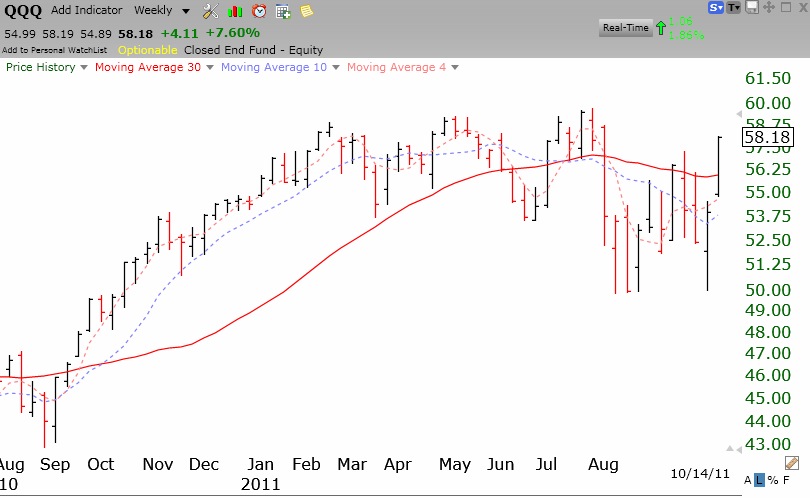
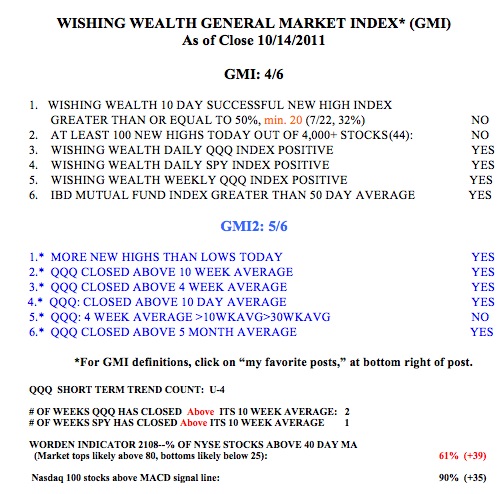
The QQQ short term up-trend is now 9 days old. The Worden T2108 is now at its highest reading (68%) since last July. There were 85 new 52 week highs on Friday, the most since last July. This market is showing some signs of life. The GMI is at 4 and could turn 5 on Monday with a strong up day. 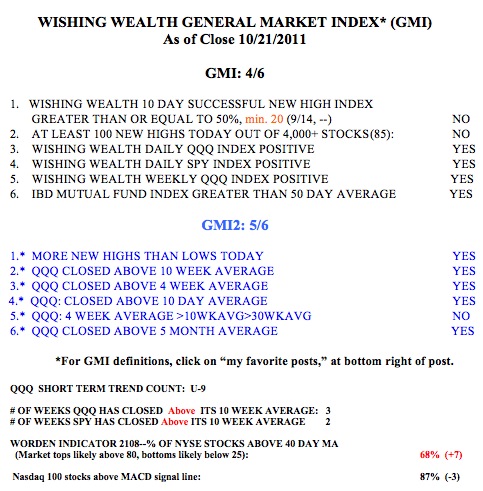 The major index ETF’s (DIA, QQQ, SPY) are now above their 10 week averages. 80% of the Nasdaq 100 stocks closed above their 30 day averages and 87% closed with their MACD above its signal line. All of these indicators reflect technical strength. The only technical sign of weakness in my scan is that the QQQ daily 10.4 stochastics is declining from overbought levels and is now at 75. But this indicator can stop and turn on a dime, or continue until it reaches oversold levels, below 20. I wrote a while ago that my university pension is now invested 100% in mutual funds again. I am also wading back into the market in my trading accounts. We are likely in the period when the market is turning and most pundits are skeptical or bearish. The Investors Intelligence poll of advisers still shows more bears than bulls. That is very comforting, given that the majority is usually wrong at market turns.
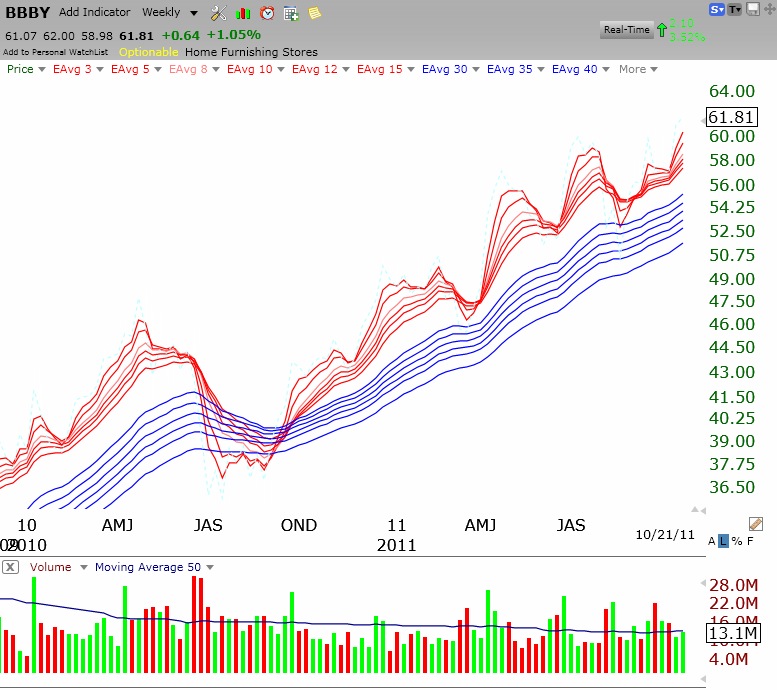
Ten stocks hit new highs on Friday and passed my scan for strong technicals and fundamentals: TDY,ENB,SXL,CELG,OKS,QCOR,CASY,CNP,GWW,BBBY. My undergraduate students should research these stocks for possible purchases in their virtual stock challenge accounts. Check out when they are scheduled to announce earnings. Below is the weekly GMMA chart for BBBY, which is clearly an RWB rocket stock. (Click on chart to enlarge.)