The GMI is at 1 and the GMI2 is at 3. While the short term trend of the QQQ is still down, its longer term trend is up. Still, the GMI sell signal from early May remains in effect. The QQQ and SPY have each closed below their 10 week averages for 6 weeks. 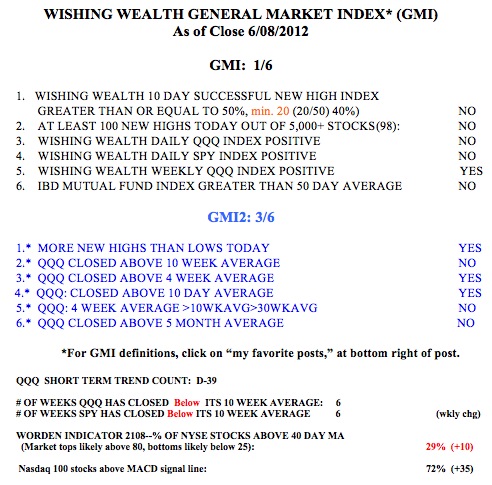 I cannot consistently make money trading on the long side when these indexes are below their 10 week averages. The Worden T2108 is in neutral territory, at 29%. Interestingly, 72% of the Nasdaq 100 stocks closed Friday with their MACD above its signal line, a sign of short term strength….
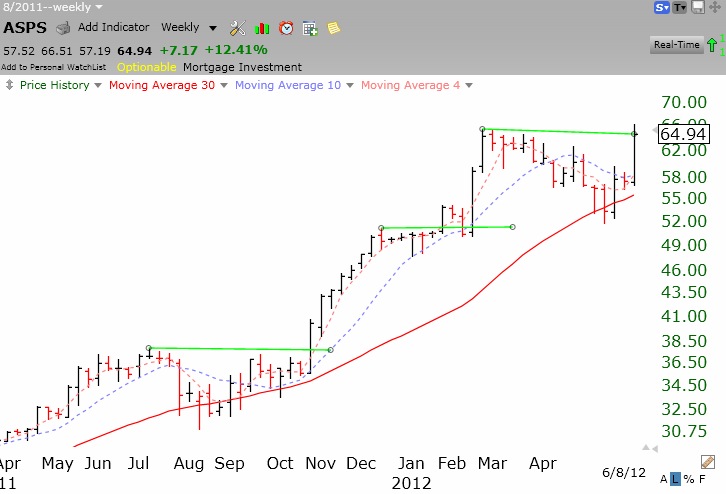
Only 98 stocks out of almost 6,000 hit a 52 week high on Friday. It is in the new high list that I look for the leaders of the next move up. Any stock that can reach a new high, and especially an all-time high, during protracted market weakness is likely to be reflecting some serious buying pressure. One stock that did so last week is ASPS. I wrote about ASPS last November when I thought it was breaking out of a a cup-with-handle base. At that time ASPS was trading at $43.50. ASPS has continued to rise and hit a new high last week, closing near $65. I have found that weekly charts are quite good for identifying break-outs from multi-week bases. The weekly chart of ASPS below shows green horizontal lines which mark the tops of bases. Note the base last November when I first wrote about ASPS. Another base formed around the end of 2011. It looks like a new base that began in March has just been penetrated. ASPS rose 12% last week. I have no idea if this break-out will survive the current market gyrations, but I could not resist taking a small position in ASPS last week. I will only add to my position at higher prices, after it confirms a continuing up-trend. I have already researched ASPS and have found that the stock meets my technical and fundamental criteria for a growth stock. The fact that the break-out last week was accompanied with the highest weekly volume in 13 weeks is another promising sign. The stock has also recently found support at its 30 week average (red line) as it did in 2011. I will watch ASPS carefully…….