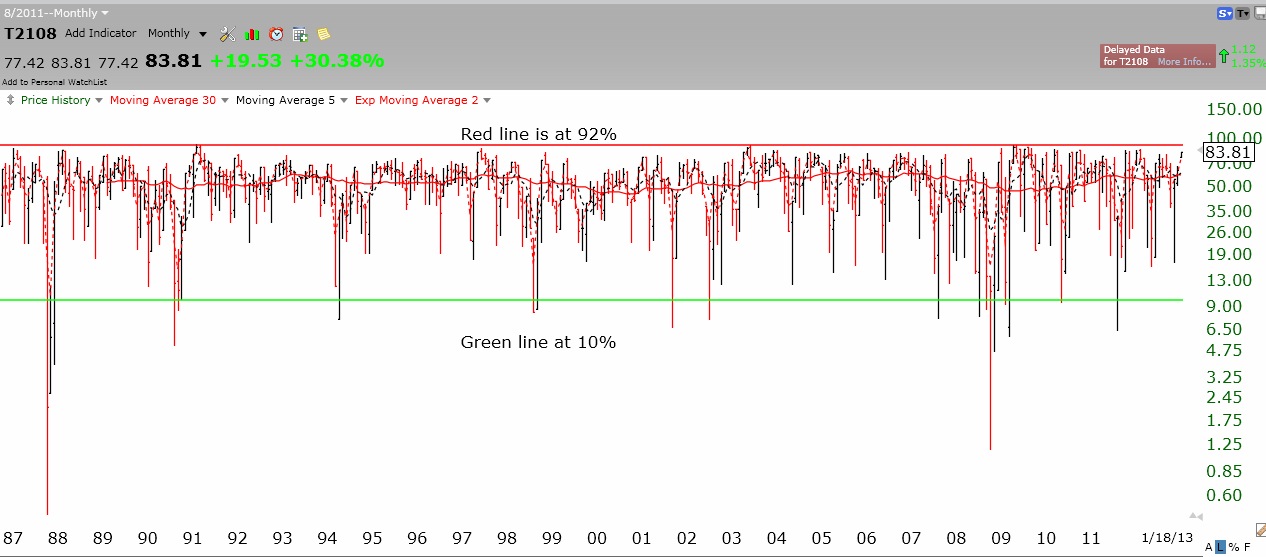
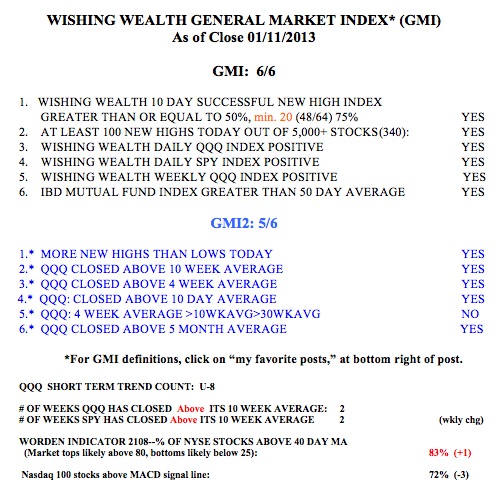
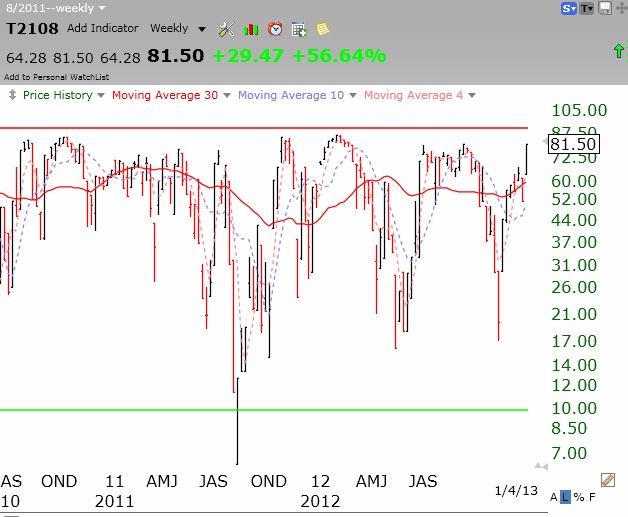
QQQ short term up-trend reaches 7th day; weekly Guppy chart shows resumption of up-trend; AAPL strong

GMI5/6
GMI-25/9
T210874%

I am impressed by the action of the leaders on Friday, especially of AAPL (which I have bought call options on).   Five of my nine leaders rose on Friday.   Growth stocks are back in vogue. The GMI and GMI2 are both at 5, of 6 and both the QQQ and SPY are above their 10 week averages.   I therefore must not fight this up-trend.   Options expire on Friday and then we are into 2nd quarter earnings releases.

A reader asked me to post the GMMA chart for the QQQ.   The weekly chart below (click on chart to enlarge) shows that the market has held support and the shorter term averages (red lines) have turned up.

Nevertheless, I am still worried about whether the debt limit talks will be resolved on time.   I remain largely in cash in my university pension until the situation is resolved.   And yes, I realize I let the news and my emotions take priority over the market’s action.   But sometimes it pays to be on the sidelines so I can sleep at night.

My more speculative money is in the market in some call options in tech stocks.   When AAPL rises during a steep market decline like Friday’s, it indicates to me a lot of underlying technical strength.   And I love my new iPad!   I can easily access TC2000 on it and run scans and my favorite charts. I buy AAPL cautiously, however, knowing that any bad news about Steve Job’s health would likely send the stock on a sharp decline.

Amazing snap-back, but will it hold?

GMI6/6
GMI-24/9
T210870%

IBD has today labeled the market in a resumed up-trend, even though there was never a classic follow-through day.   See today’s IBD for their rationale (or rationalization). And my indicators are now positive, maybe too positive.   The GMI is now 6. In just a few days, the T2108 indicator has risen to 70%, near where markets top.   And the daily stochastic that I follow for the QQQ is now near 100% and as high as it got on recent   up-moves. Friday was only the 3rd day (U-3) of the new QQQ short term up-trend.   This was an amazing reversal in just one week. The key to this market is whether this rise will extend to a new recovery high or peter out before.   If the market cannot close at a new high (QQQ above 59.34), the ensuing decline could be violent.   It is not a good idea to fight the trend of the market, however—and the trend is up, for now. I would like to see this new up-trend   get to at least 5 days before I start to slowly wade back into   this market.

No one knows when this market will bottom

GMI0/6
GMI-2O/9
T210821%

Once a decline begins, no one, including all of the media pundits, can accurately predict the bottom.   It is up to every person to determine his/her acceptable level of risk.   Contrary to the prevailing media wisdom, one does not have to stay in the market all of the time.   One can get out and wait for an up-trend to emerge.   The often cited studies that say that one ‘s portfolio underperformed if s/he were out of the market during the days with the largest gains fail to note that one did the best if s/he was out of the market during the days with the worst declines!

I think it is possible to time the market. People also say that once you get out you will miss the bottom and some of the subsequent rise.   Hogwash!   If I get out of a mutual fund at say, 80, and it falls to 60, as long as I get back in before it goes back above 80, I have managed the risk and done well. And maybe I will get back in around 70 and come out way ahead.   I have not exited my university pension mutual funds because of their unacceptable rules against market timing. However, if I were in mtual funds or better still, exchange traded funds which I could trade at will, I would have taken some money off of the table by now.

The technicals are terrible, as reflected in the GMI and GMI2 both registering zero.   My trading account doubled since I went back into the market last September at the beginning of the multi-month rally.   On September 7, the GMI reached 5 and began a long stream of 5’s and 6’s.   Think how well I could do if I only stayed in the market when the GMI was strong!   So, I did give up some of my gains as the GMI weakened, but my trading account is still up about 70% since last September. My trading gurus, Darvas and Livermore, used to say that no one forced a person to be in the market and one should only go in when the conditions look favorable. And they couldn’t look much worse right now.

The GMI and GMI2 are both zero out of 6.   All of my short and long term indicators are negative.   I do not try to interpret how political and economic events might affect the market.   If the reasons for the market’s movements typically become evident after the move, it makes sense to focus on   the movement of the market and to not attempt to read the tea leaves.   So, almost all of my indicators are designed to discern the current trend of the market. Once I know that, the correct strategy becomes clear to me.   The QQQ short term down-trend has now lasted 19 days, but we had a 29 day decline in June, 2010, and a 69 day decline in December, 2008. If we are at D-19 now, it could continue for a while.

However, I do have an indicator that gives me some idea of how oversold the QQQ is now, relative to other recent declines. The chart below of the weekly 10.4.4 stochastic suggests to me that the current decline is approaching the severely oversold levels seen at other recent market   bottoms, even during the 2008 debacle.   Note that the fast stochastic line (black) in the bottom panel is almost below the horizontal line designating 20%.(Click on chart to enlarge.) However, other big declines ended below the 20% level.   So, we may have more to go on the downside. But for me, this is not the time to begin to go short. Then again, no one knows for sure.