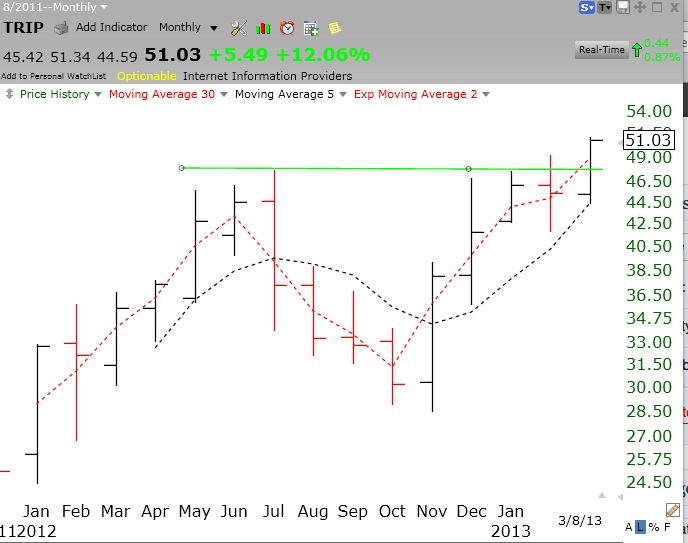
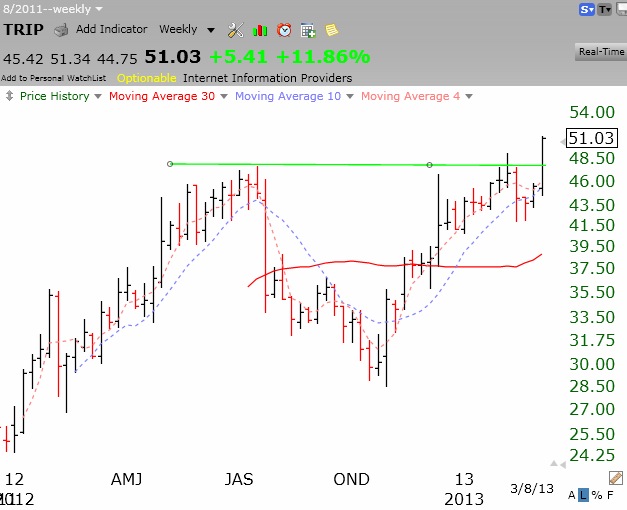
One of my most important discoveries is the green line chart. If you go to the side of my blog and select the video I did last December you can see how I build green line charts. That segment is about 78 minutes into the video. Green line stocks are those that have been advanced to an all-time high, consolidated, and then broken out to a new high. These are the winners I seek to own. Any stock that has this pattern is showing unusual technical strength. Furthermore, a stock at an all-time high has no persons who bought at higher prices and are now trying to get out. Said in another way, a green line break-out stock has no overhead supply of stock from people who bought at higher levels and are holding losses. Once I find a green line stock I look to see if the break-out occurred recently and whether it has the type of technical and fundamental characteristics I like. Recent green line break out stocks I own are TRIP, Z, IBM, AXP and CVX.
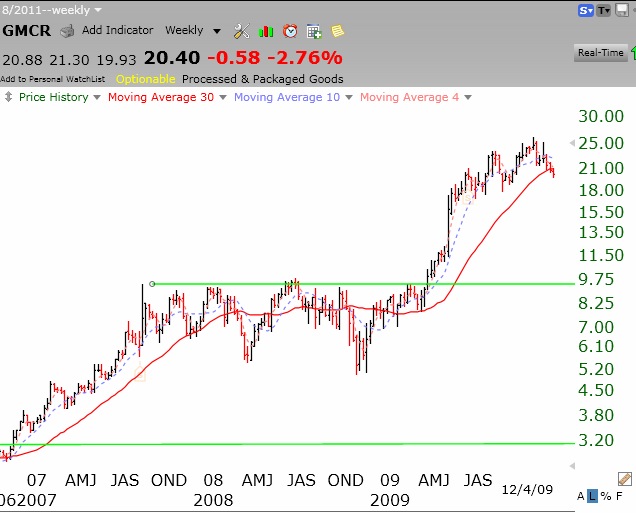
Back in March 2009, after the devastating market decline, I wrote about GMCR approaching an all-time high. I opined that any stock that could come through that market decline near an all-time high was showing amazing technical strength. I had not discovered the green line approach, but it is interesting to go back to that period and draw it in. Look at this weekly chart of GMCR in 2009, which has been adjusted for stock splits. GMCR went on from that break-out to advance almost 900% before peaking in late 2011. Stocks breaking out of a green line top after a large market decline can become huge winners.
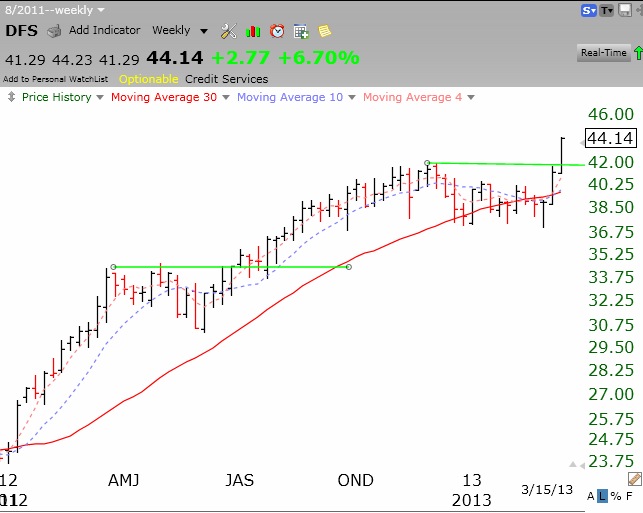
I have a green line break-out scan I wrote for TC2000. Among the green line stocks to show up over the weekend are: WAT, DFS, CAB, NEE, BCE, BOKF, ATR, WSO. I draw the green line on each monthly chart and then examine how it looks on the weekly chart to see how recent the break-out was. DFS is a pretty chart of a stock that had a green line break-out last week.
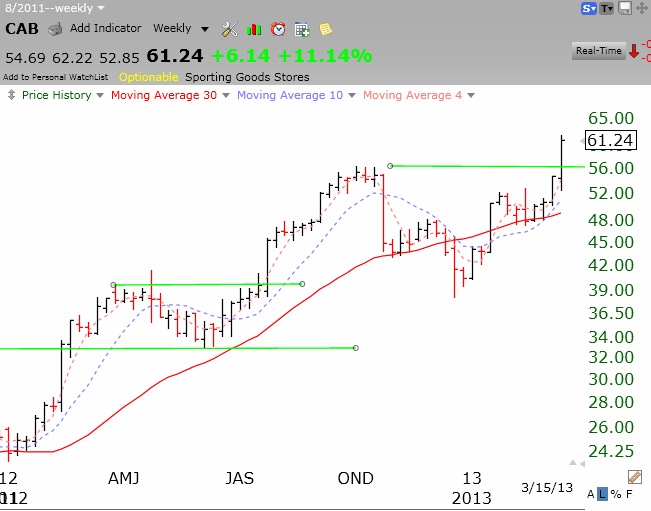
Another example is CAB.
The way I invest in a green line break-out is to buy a little and wait to see if the green line holds. If it does, and the stock gathers strength I add to my position. A lot of stocks will fall back to the green line before they advance. Green line patterns are longer term in nature and meant to find stocks that will rise for months. Of course, no one knows whether a green line break-out will succeed. That is why I make a small pilot buy and give the stock a chance to prove its strength. I then get out of those that weaken and add to my stronger positions.
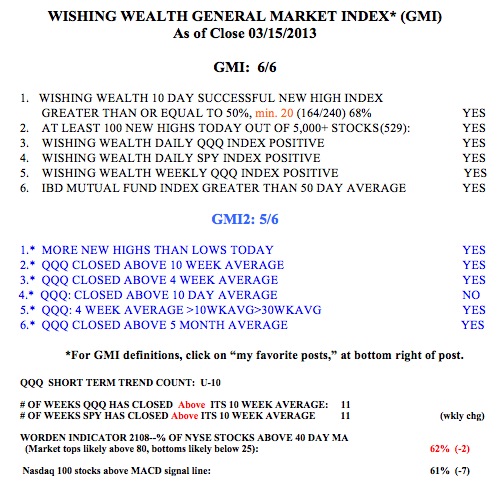
Green line patterns work best in up-trending markets, with the GMI on a buy signal–like now. The current GMI buy signal has been in place since February 28. The GMI is at 6 (of 6) and the GMI-2 is at 5 (of 6). Friday was the 10th day (U-10) of the current QQQ short term up-trend. It remains to be seen whether the QQQ will catch up to the SPY and DIA.
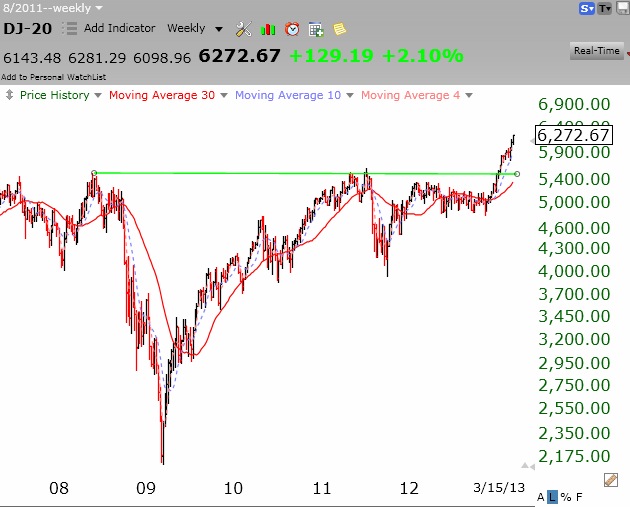
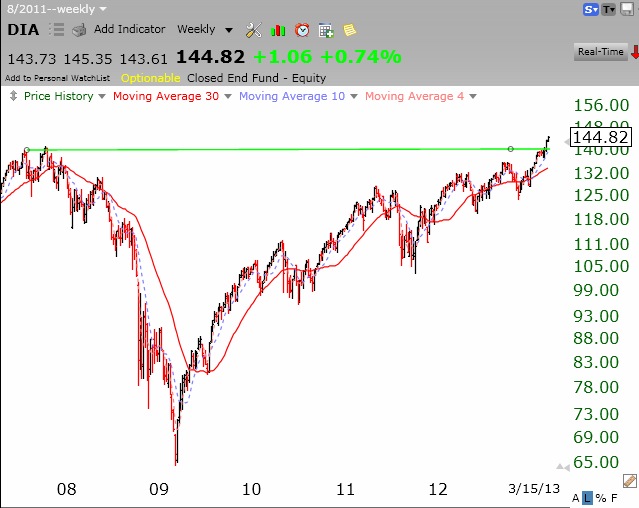
By the way, note the recent green line break-out in the Dow 20 Transportation Average. All of those pundits who are suggesting that this market may be too high, may be missing the impressive new up-trend in this critical component of the Dow Theory. The DIA has also had a recent green line break-out, completing a classic Dow Theory buy signal.