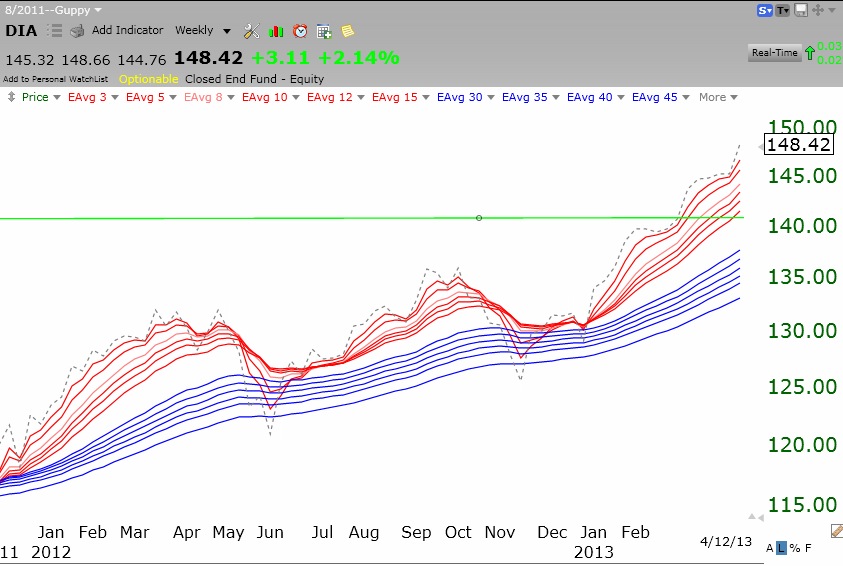
All of my indicators remain positive. Most important, the QQQ has now closed back above its 10 week average price, after closing below it last week. It is amazing to me how many of the media pundits are saying the market is too high when the SPY and DIA have just broken through their green line tops to all-time highs. When a stock or index does this, it often is followed by a multi-month rise. While a rise is not guaranteed, the index or stock should stay above its green line level. If it fails, like GLD (see example below) and AAPL did a while ago, then I would expect a major reversal of the-up trend. The critical key is to not anticipate a change in trend, but to react after the signal is evident. Such is the goal of the trend-follower. Take a look at these weekly Guppy charts of DIA and SPY. They both have the RWB (red, white and blue) rocket pattern.
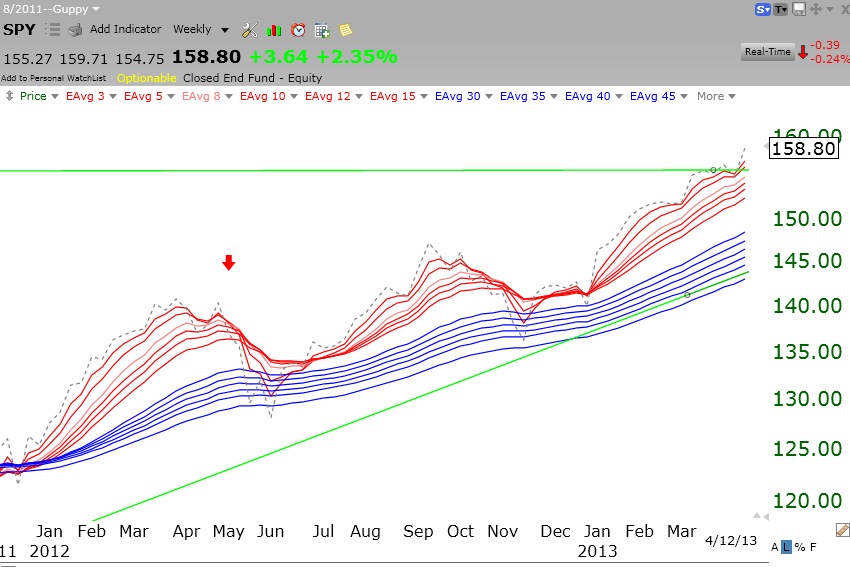
Even the QQQ is in an RWB up-trend, although it is far below its green line top, around 119, reached in March, 2000. 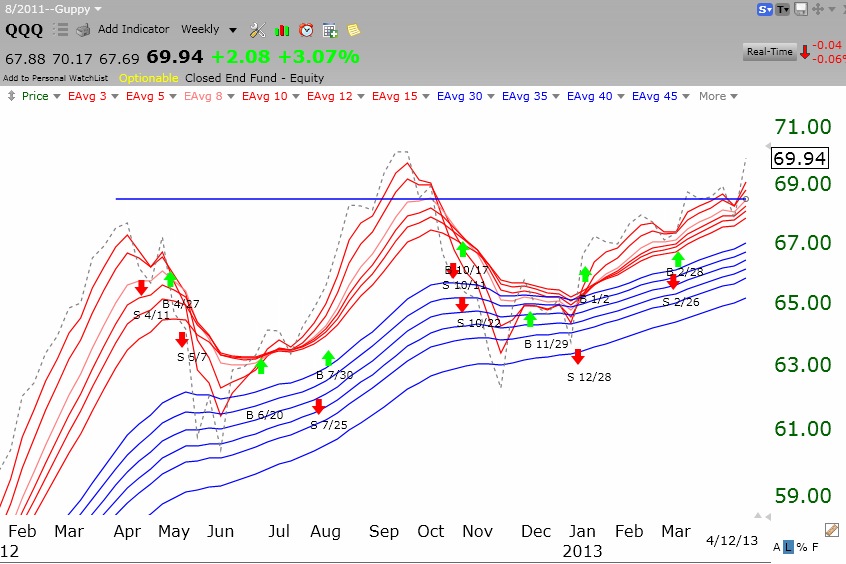
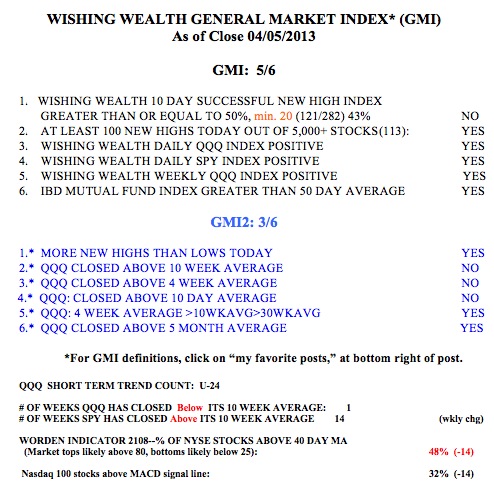
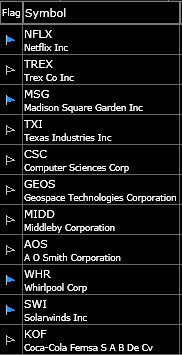
If these RWB patterns fail and the GMI flashes a sell signal, then I would reassess the market trend. For now, I must assume that the up-trend will continue. I am therefore using TC2000 to scan for promising stocks. I ran my scan that looks for a daily new high that also has technical strength and recent good earnings increases. Here is the list of 7 stocks that came up based on Friday’s action.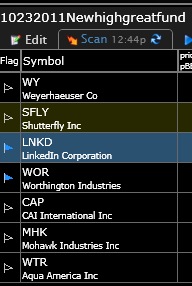 Interestingly, two are in the same sub-industry, SFLY and LNKD, which I own. The blue flag on the left indicates that LNKD and WOR have shown up in one of my IBD stock watch-lists. A glance at the monthly charts for these stocks shows me that WY and SFLY are close to breaking though their green line tops to an all-time high. The other five stocks have broken above their green line tops in the past few months. Thus, all of these stocks are worthy of my subsequent review for possible purchase. No one knows which of these stocks, if any, will rocket higher. The key is to approach every purchase as if it will fail, and to have a ready exit strategy that will minimize losses. One successful trader I read has said that one could probably trade profitably by picking stocks by trial and error, as long as one quickly abandoned the losing positions with a small loss. As he did, I use technical analysis instead of trial and error. The Wall Street maxim, cut your losses and let your profits run, is still sage advice. The GMI stats appear below.

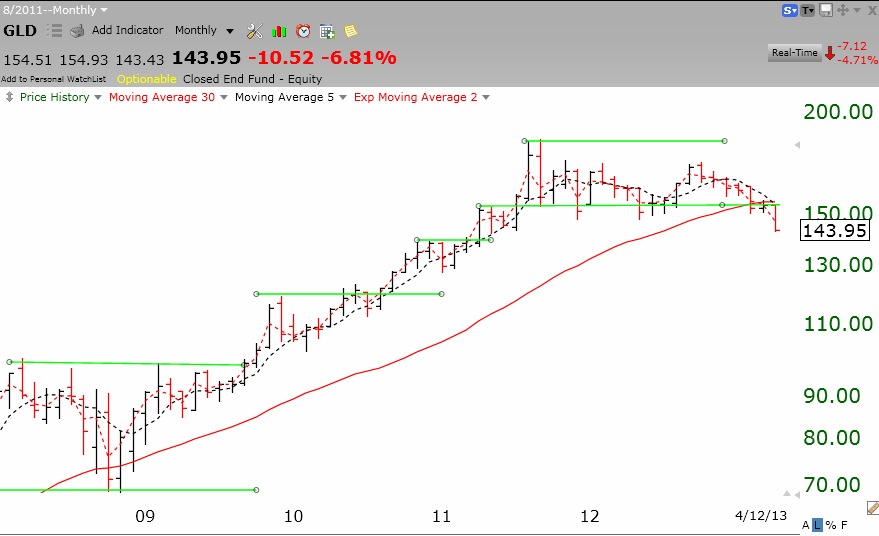
By the way, gold tumbled last week. If you take a look at this monthly chart of the gold ETF, GLD, you will see that this decline should have come as no surprise. GLD has been below its 30 week average (weekly chart not shown) and in a Weinstein Stage 4 decline since February and its green lie break-out last July has failed and GLD has established a new green line top. I trust that none of my students would have been holding GLD, thinking it was a bargain as it fell. I suggest that the time to buy a stock or ETF is when it first breaks above a green line top to an all-time high, a sign of major strength. That is how the great Nicolas Darvas made a fortune. You can find his book listed to the lower right of this site. It is the first book that I assign to my college students.
By the way, the link to my free December TC2000 Houston webinar appears to the right of this blog page and will provide you with an extensive introduction to my university class and trading strategies. I welcome your comments, please.