I spoke at the Baltimore AAII meeting on Saturday and enjoyed meeting many people. Some had traveled from Philadelphia! I neglected to tell them of a great vegetarian restaurant in Philadelphia, which I have traveled to, just for dinner–Vedge! It was the best vegetarian dinner I have ever experienced–outside of my wonderful wife’s! The travel to that restaurant venue is worth it!
So thank you for coming out of your way to learn about my experiences. Many were TC2000 users. I talked about the green line charts and the many successful authors I have read who have shared their methods. I always ran out of time. If you missed it, you can get a summary of much of my strategy by listening to my December 2012 webinar with the Houston TC2000 users group, the link to which also appears to the right of my blog. The attendees yesterday were largely “Boomers” who are thirsty for ways to preserve their wealth and survive in retirement–as am I. We all have vivid memories of the market melt-downs in 2000 and 2008 and are trying to grow our assets while preserving them from another market debacle. Perhaps the most important lesson from my experiences that I wanted to pass onto them is that it is not a crime to get out of the market and to sell down to the sleeping point (when one is comfortable with one’s portfolio risk). Of course, when one sells in a taxable account one has to be mindful of the tax consequences and wash sales rules. My trading accounts are in IRA’s and tax deferred, so I have no immediate tax consequences when I buy and sell……
I told you last week that I went to cash in my trading accounts. I saw no reason to try to navigate this volatile market environment until the debt limit extension has been passed. However, I remain invested in mutual funds in my university pension accounts because the markets I follow (SPY, DIA, QQQ) appear to be in Stage 2 up-trends. I also noted that one does not have to exit or enter all at once. I often wade in and out, in stages. I only add more to my position if the market moves in the intended direction of my prior purchase. I never average down and add good money to bad. I also told the audience that the best strategy for me might be just to own the SPY, using Stage Analysis to time entries and exits. For larger returns, one might use the leveraged short and long S&P500 ETF (like SDS, UPRO, SH, SPXU). Leveraged ETF’s are more risky because they go up and down faster than the underlying index. I also said to have an exit plan for every trade.
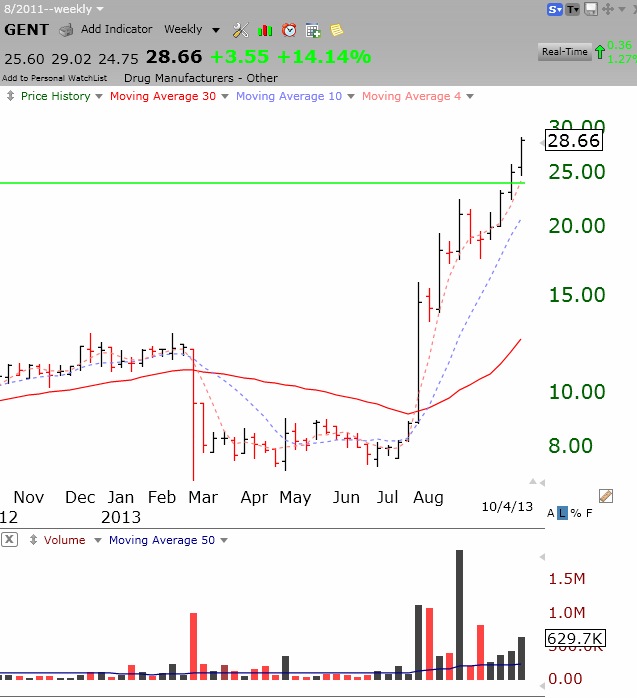
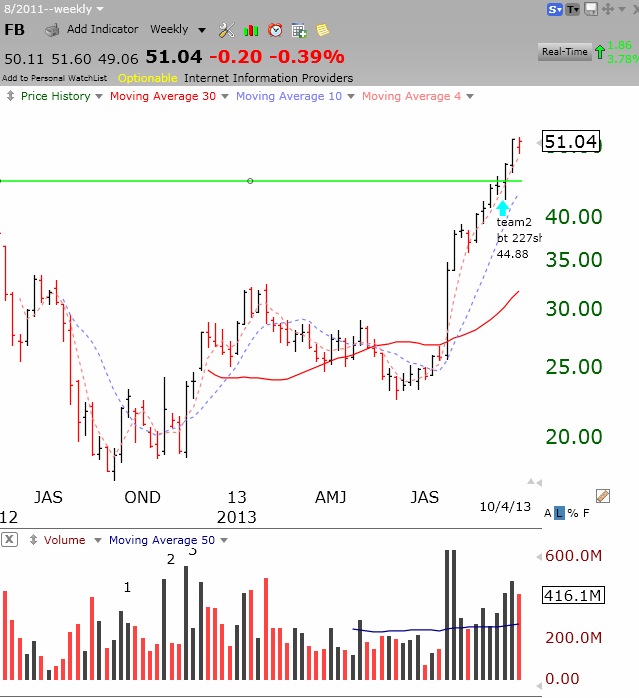
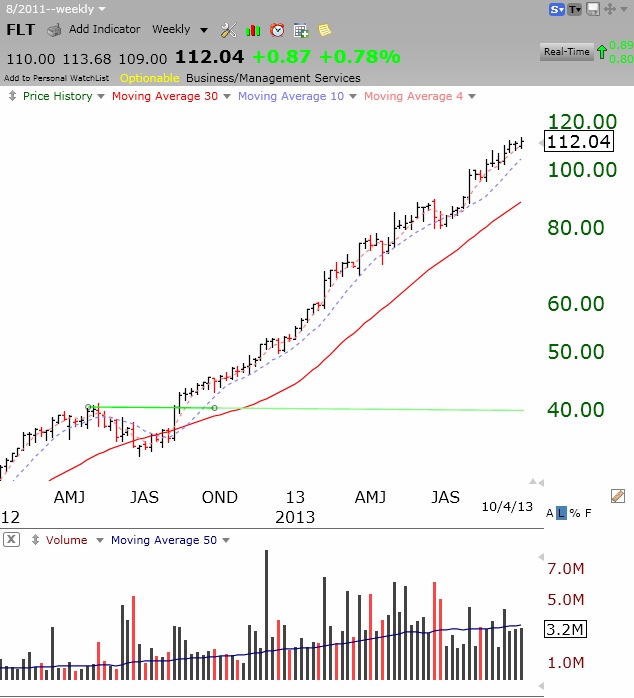
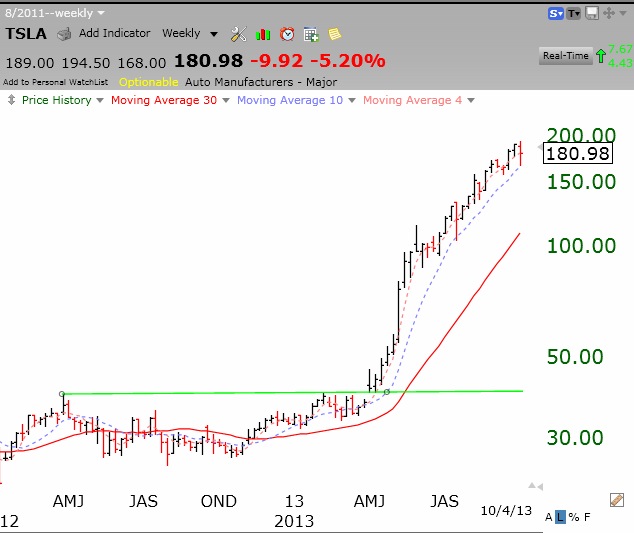
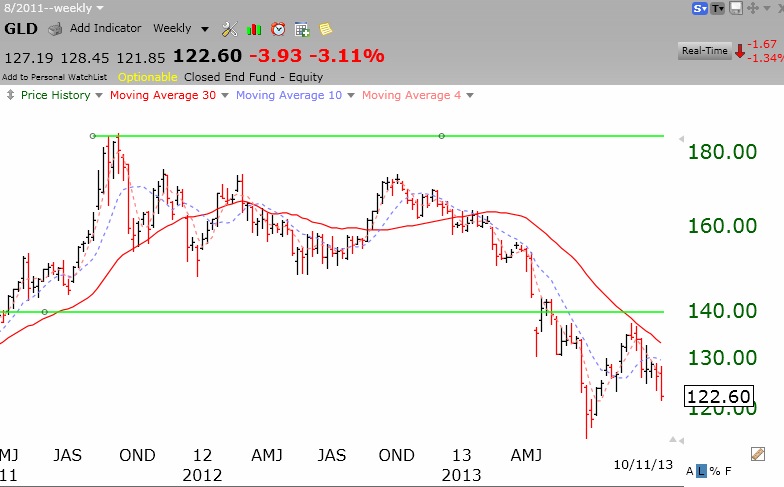
I spoke a lot about green line charts and Weinstein Stage Analysis. I think this chart of GLD (the gold ETF) illustrates the strength of both. When a green line break-out fails, it is often a sign of technical weakness. Stocks should break through a green line top and keep rising. When a new green line top is formed (after 3 months without breaking its all-time high), I watch for an exit. When the equity also enters a stage 4 decline, it is a sign to me that I should be out of the security or short it. Look at this weekly chart of GLD. After forming a new green line top in late 2011, GLD entered a long Stage 3 with a somewhat flat 30 week average (red line), and entered a clear Stage 4 by April, 2013, below a declining 30 week average. I never hold a security that closes below its 30 week average. (Click on chart to enlarge) While I do not show the chart, GLD had been in a Stage 2 up-trend from 2009-2012! When might GLD be a good investment for me? When it enters a Stage 2 up-trend.
Meanwhile, the SPY is in a clear Stage 2 up-trend and above its recent green line top. This weekly chart shows that SPY found support last week at its 30 week average. Note that it already re-tested its green line break-out 15 weeks ago. A close back below the 30 week average (around 164) would be a serious break-down, but it would take a long time for SPY to enter a confirmed Stage 4 decline.
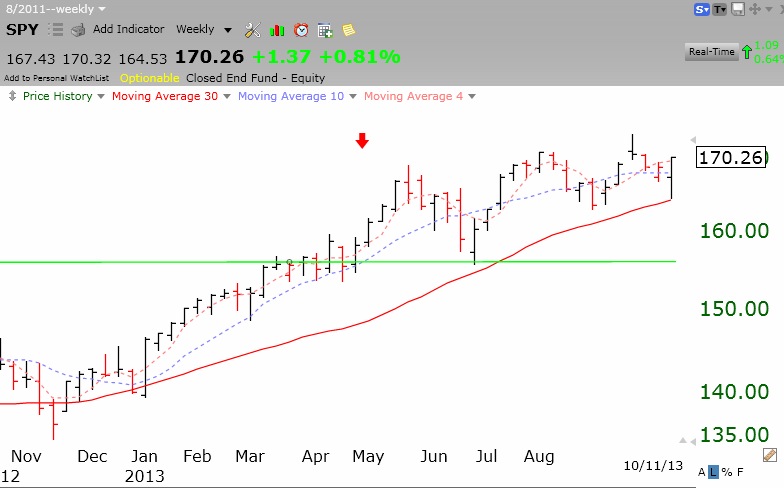 I will therefore wait out the week in cash in my trading accounts.
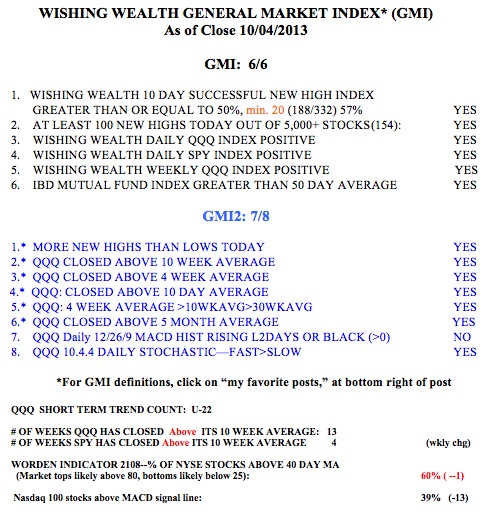
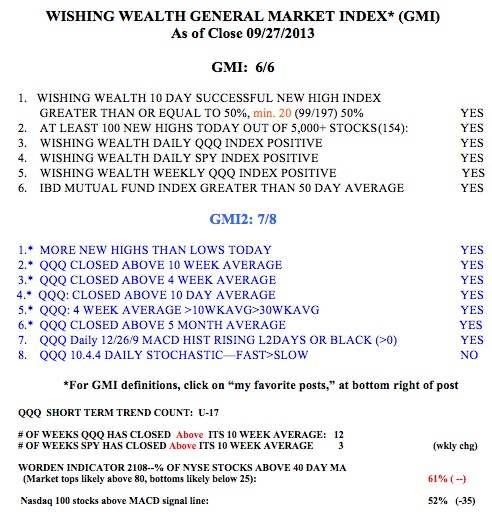
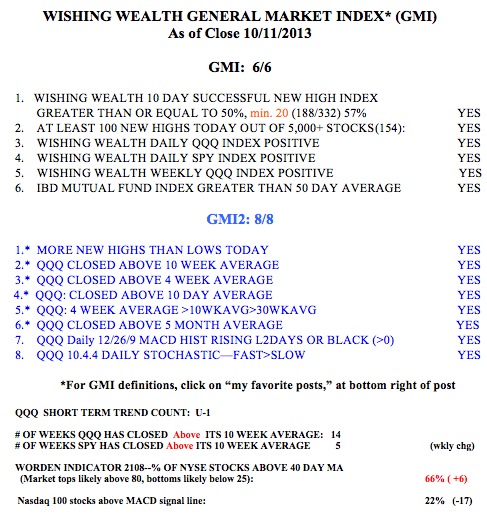
Meanwhile, IBD still sees the market to be in an “uptrend under pressure.” The GMI and GMI-2, however, are both at maximum readings. If I flew just on instruments I would be long–but then there is the debt ceiling…… I prefer to wait before I wade back in.
 If you are new to this site and want to get my posts by email, sign up in the spot to the right of this post. Also, if you order any of my most favorite books listed on my site, my webmaster (and son) would be very grateful. The emails are sent out at 7:00 AM but you may also access the post on my blog the prior evening.