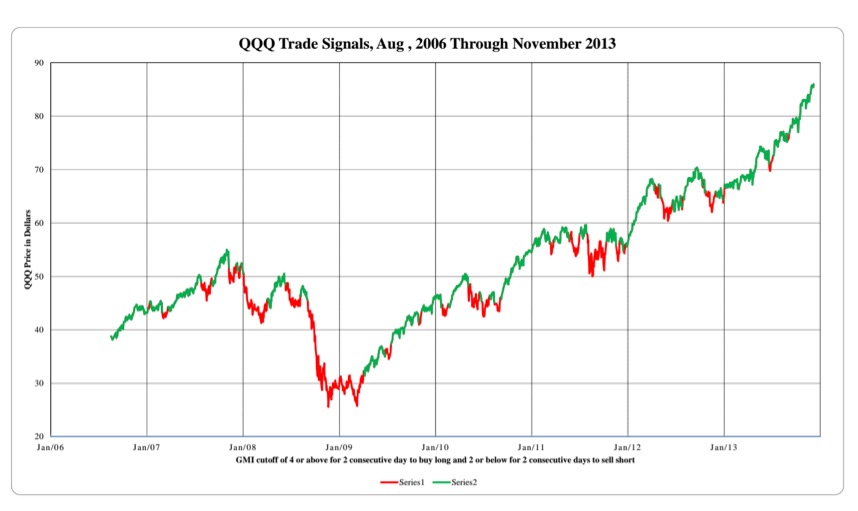
The media pundits say it is impossible to time the markets. By making investing appear complex and beyond most people, they protect their jobs and the jobs of many financial advisers. I have been able to use a few simple indicators to keep me out of the major market declines. I protected my pension from the 2000-2002 and 2008 declines. Below is a chart showing the periods when the GMI was on a sell signal (in red) versus a buy signal (green) since 2006. The GMI, a collection of six indicators, has helped me to get out of the market during the major declines. Yes, there are times when the GMI gets whip-sawed, but only for a few days. I so not mind going to cash and then re-entering on a new buy signal in my trading accounts. The problem is that my pension plan prevents me from market timing. They want me to ride the market down in a large decline. I refuse to do so. Below is a graph of the GMI signals as they apply to the QQQ. Click on it to enlarge. Judge for yourself if you would have preferred to be out of the market or more defensive during the periods of red days. You can also check out the strategy of using GMI signals to trade QLD the past two years here.
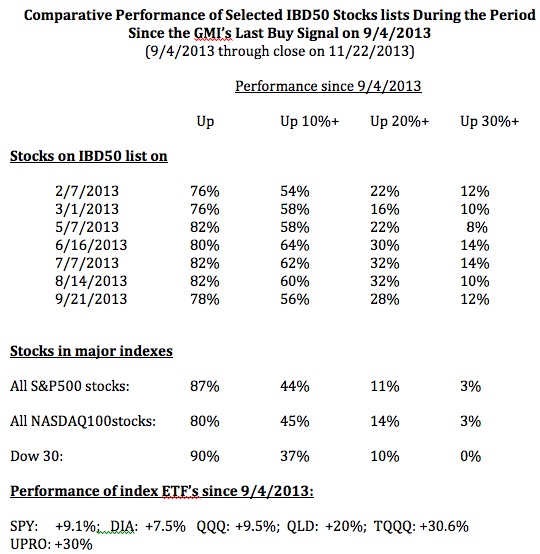
 One of my perspicacious honors students questioned my analysis of the IBD 50 stock lists’ performance during the period since the last GMI buy signal, which I posted a few weeks ago. He suggested that while the IBD 50 stock lists might have had more large gainers than the stocks in the major indexes, perhaps the IBD 50 lists also had more big decliners. So, I am re-posting below the table I posted a few weeks ago, with the addition of a new column (in red) showing the percentage of the IBD stocks that declined 10% or more in the study period. The data do not support his hypothesis. I found that 2%-10% of the stocks in the IBD 50 lists declined 10% or more, not very different than the NASDAQ 100 stocks (8%), but a little more than the Dow 30 (0%) and the S&P 500 stocks (3%). Furthermore, there were very few of the IBD 50 stocks that declined as much as 15%. So we are left with the conclusion that the IBD 50 stock lists were much more likely to contain stocks that had large gains (more than 20% or 30%) but are not more likely to have large decliners. Thus, the IBD 50 lists were more likely to contain stocks that outperformed, at least during the period I studied. Nevertheless, I do know, and IBD has said this, that the IBD type growth stocks do tend to decline more than other non-growth stocks during major declining markets.
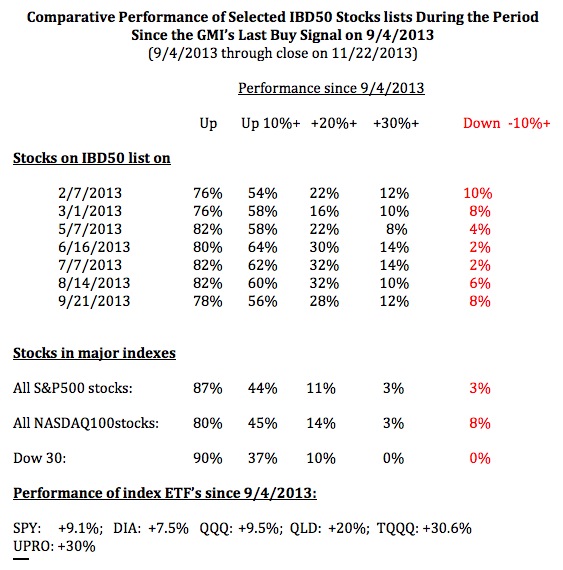
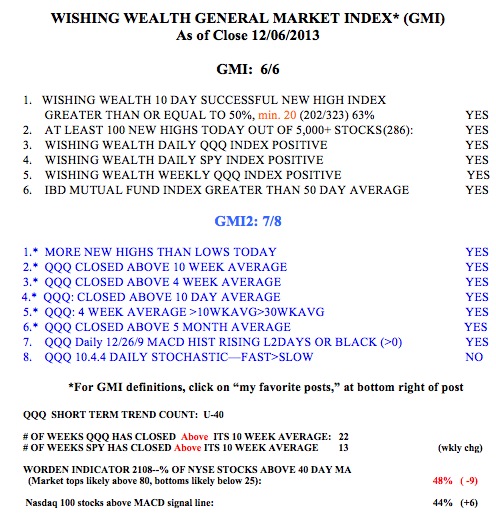
Finally, here is this week’s GMI table. While all but one of my indicators are positive, I am aware that investor sentiment is getting quite optimistic. (But the Worden T2108 is only 48%!) Until this extreme bullishness translates into low GMI readings, I remain 100% invested in mutual funds in my conservative university pension accounts.