The market bounced from its oversold condition on Friday. Market indexes rose on higher volume than the preceding day, a good sign. IBD still sees the market in a correction and is waiting to see if we get a follow-through day at least 4 days after Friday’s rally. To undertsand the IBD strategy, you must go to their website, investors.com or read their newspaper.
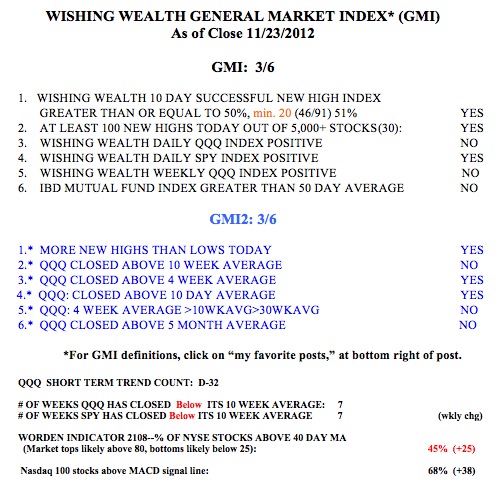
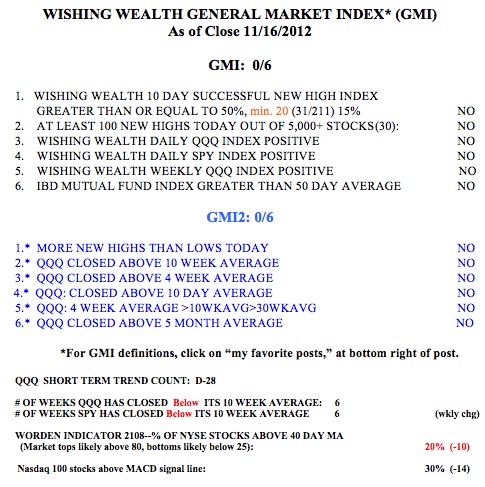
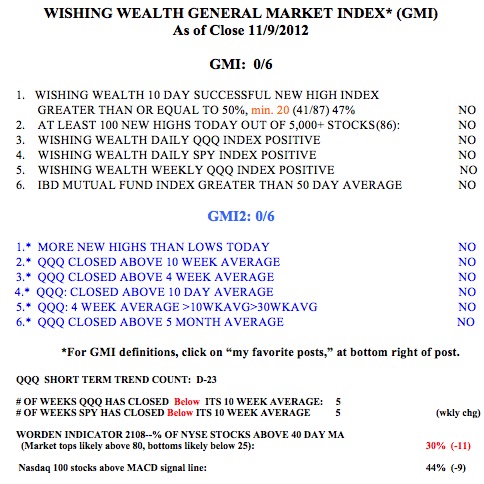
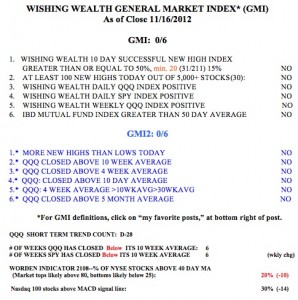
Meanwhile, the GMI remains at zero and Friday was the 28th day of the QQQ short term down-trend. I noted weeks ago that if the leader, AAPL, could not climb, it was an ominous sign for the market. AAPL almost reached $500 on Friday and then bounced. This is a good sign but it will take a while to determine whether the $500 level will hold. A trend follower does not predict the market, but follows the prevailing trend. The GMI will flash a buy signal sometime after the bottom is in place. I never expect to get in at the bottom. With the market in a short and long term down-trend it is safest to be in cash or short. After I can assess the strength of this bounce, I will decide whether to reenter the market on the short side or to wait for more signs of a true reversal. The market is out of the severely oversold status it was in on Thursday, with just 3 of my four oversold indicators positive as of Friday’s close.
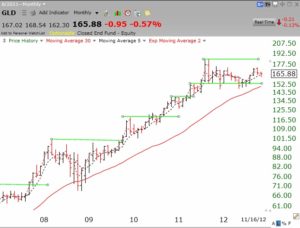
I thought you might like to see a greenline chart of the gold ETF, GLD. I draw a green line top at a monthly peak that has not been exceeded for several months. Note from this chart that GLD has broken out of several multi-month bases. However, the last break-out occurred in July 2011, and now GLD has formed a new top. We need to wait to see when/if the recent top around $185 is exceeded. Until then, GLD appears to be in a long period of consolidation. I would be concerned if it could not hold the $150 area. Click on chart to enlarge.
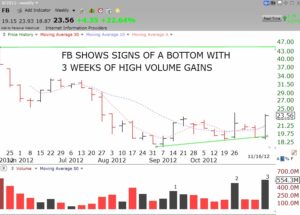
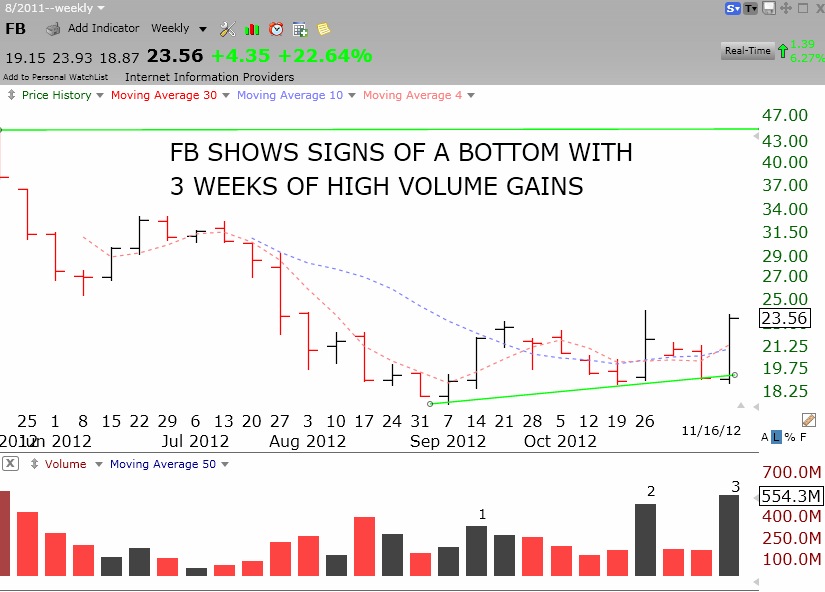
I bought some Facebook last week for a long term hold. With a billion users FB must have amazing potential. Some fund managers must agree after FB stock has had all of the excess speculation wrung out of it as it has fallen more than 50% from its IPO. FB is now showing signs of strength and probable accumulation around $19. With a major lock-up period ending last week, FB was supposed to fall as millions of original shares could be sold. But instead, FB rose 22% in a weak market environment. It is also noteworthy that Goldman Sachs is the top holder of FB stock, owning about $1.4 billion worth of its shares as of late June. Maybe they know something? This weekly chart of FB points out 3 weeks of high volume advances since mid-September. So I bought some FB to hold for months or years, not weeks. I would normally wait to buy until it exceeds its greenline top at $45, but I am willing to bend my rules and to wait for FB to recover. If I am right, then I will average up as it rises. If I am wrong and it closes below the green trend line I drew, I will exit.