We all tend to steer our cars (lives) with our hands on the rear view mirror rather than by holding the steering wheel and looking ahead. We look back to the horrific markets of 2002 and 2008 and the lack of progress over the past decade and are afraid that the current market rise is phony and doomed to fail. I read that William O’Neil, founder of IBD, has recently said that the market may be on the verge of a huge multi-year advance like the one that he accurately predicted in the early 1980’s. Jim Cramer also opined last week, after consulting a technical analyst and his charts (something that he claimed only “morons” did before many of his fundamentally based picks were decimated during the 2008 decline), that the market may be embarking on a multi-year bull market. So I used TC2000 to build this yearly chart of the S&P500 Index to take a look for myself.
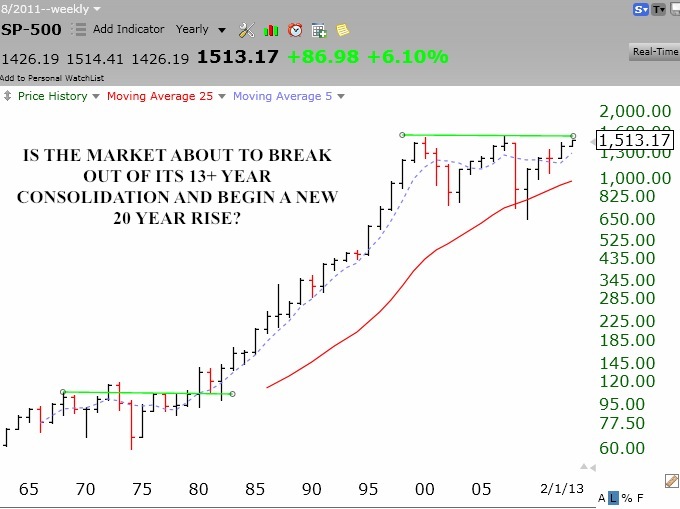
Note that each bar represents the range of the S&P500 Index for one year. For most of the 70’s, when I first traded in the market, the market went up and down in a trading range and could not break out. The Dow Jones average kept hitting 1,000 and backing off. I would make money and then give it all back and more. In 1982, William O’Neil made a terrific call on the new bull market, when most everyone else was skeptical. The market has again been in a 10+year trading range and we all are accustomed to expecting the market to hit a ceiling of resistance and to fall back down. After all, some pundits say, this bull is 4 years old and bull markets typically average only about four years—- except for the one from 1982 through 2000! No one knows whether we are on the verge of a similar multi-year bull. However, I will not sell out now because the bull market is thought to be old. Rather, I will wait for a definitive sell signal, like consecutive weeks of zeroes in the GMI. If the S&P500 Index can convincingly close above the green line in the chart (about 1570-80), it might be a good idea to stay aboard for the ride of a lifetime…..
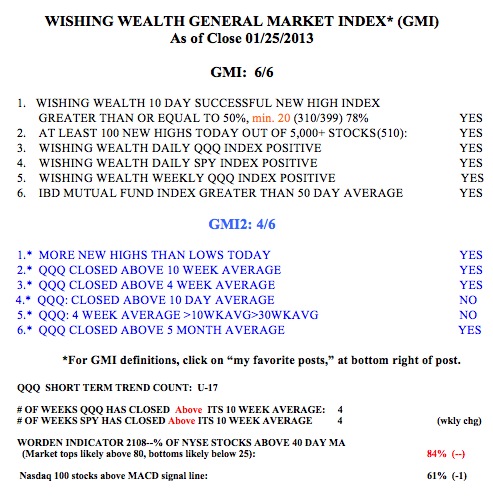
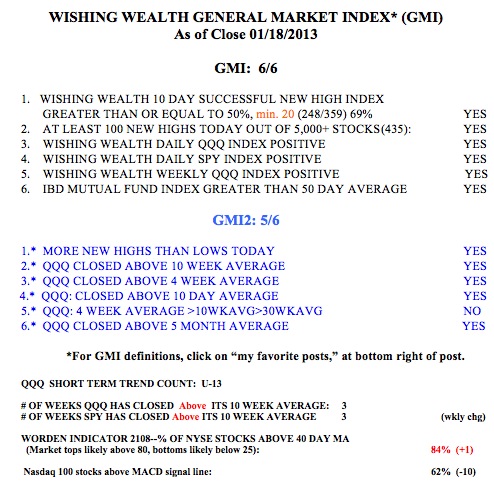
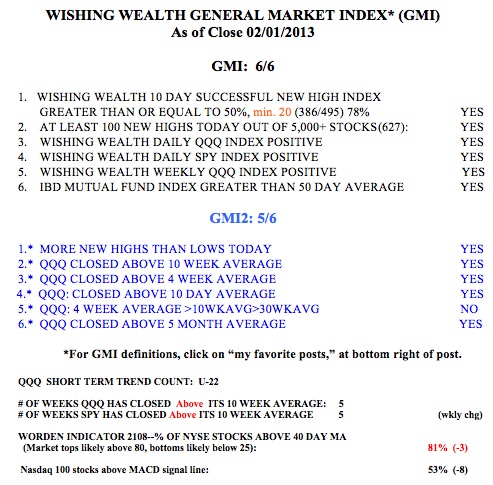
As to the GMI, it remains at the maximum reading, 6 (of 6).
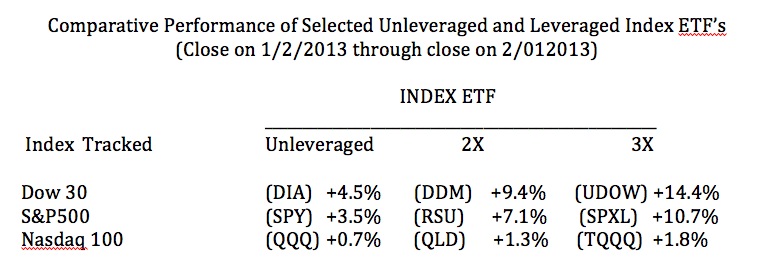
Some of you have asked me how the various index ETF’s have performed lately. The table below shows some examples for the period since the GMI flashed a buy signal, right after the big rise on January 2. The table clearly shows the recent underperformance of the tech stocks, reflected in the Nasdaq 100 Index. However, the techs may be getting ready to rise again, with GOOG hitting an all-time high on Friday. Remember, the leveraged index ETF’s go up faster but also fall faster. One must be very nimble to exit at the first sign of a weakening up-trend.