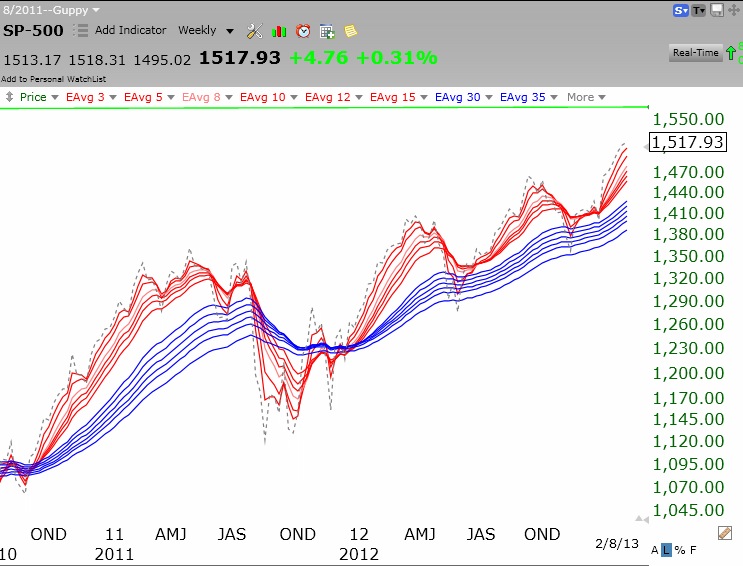
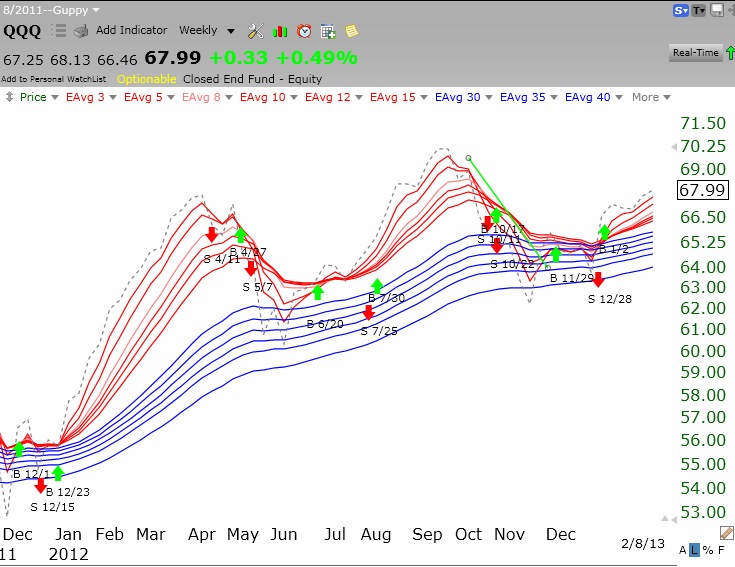
I am concerned that the chart below suggests to me a possible head and shoulders top formation. The blue line shows the daily closes of the QQQ and the red line shows the moving average of the closes over the prior 30 days. Note that the QQQ has now closed below its 30 day average, a possible sign of weakness. In addition, the left and right shoulders peaked at almost identical closing price levels, as shown by the green line. This week is critical to determining whether a major decline in the QQQ is beginning. If the right shoulder breaks down and the neckline is penetrated, the head and shoulder top pattern is forecasting around a 20% decline in the QQQ from current levels, to around 54. Interestingly, the large cap indexes, the Dow 30 and the S&P500, do not share this weak pattern. I never trust a change in the short term trend until it lasts 5 days. Friday was only day two of the new QQQ short term down-trend.
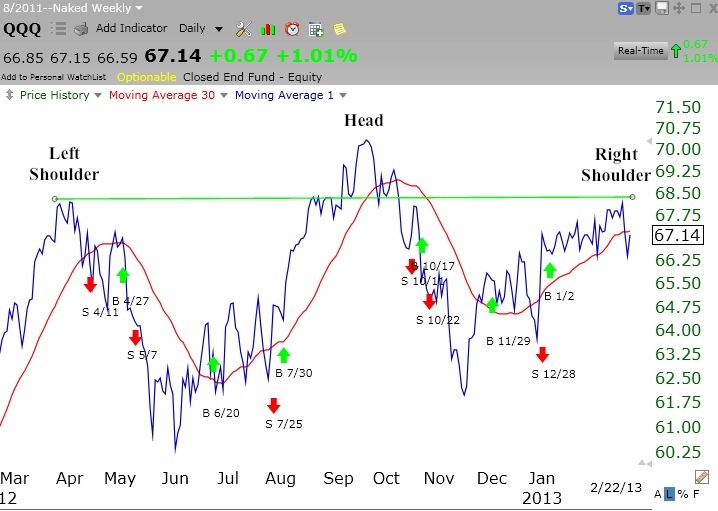
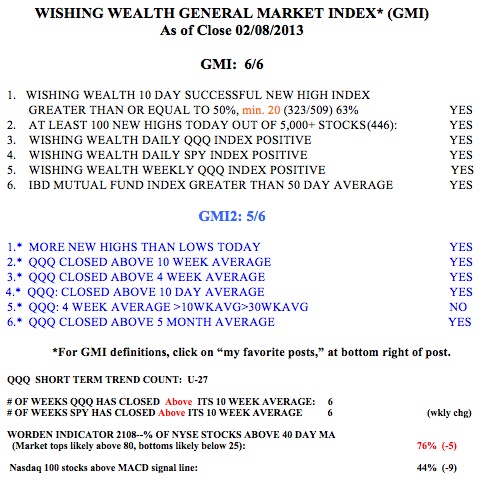
Thus, on Friday the GMI and GMI-2 each rebounded to 5 (of 6). But note that only 20% of the Nasdaq 100 stocks closed with their MACD above the signal line, a sign of short term weakness. The red and green arrows show previous GMI buy and sell signals. The GMI remains on a buy signal since January 2nd. With such conflicting signals, it is best for me not to place huge bets in either direction.