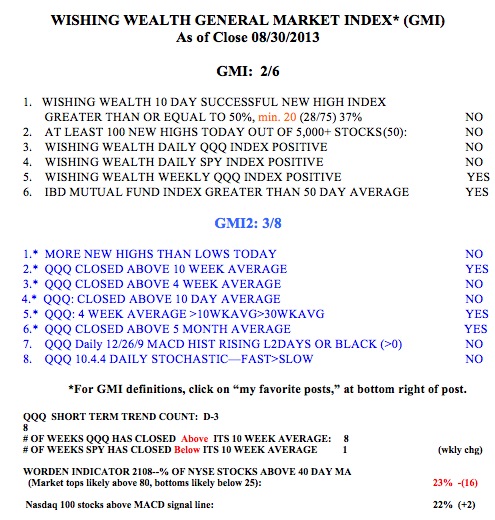
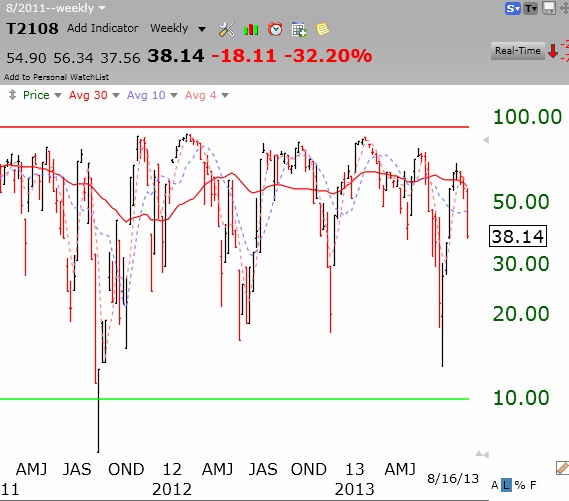
It has been a very difficult time for me to time the market. The QQQ is stronger than the SPY and DIA, which appear quite weak. But the 30 day moving average of the QQQ is flat, reflecting the cycling of the QQQ above and below it. The short term trend of the QQQ is down, but the down-trend is still young (D-3) and could easily reverse up with a couple of strong days this week. The longer term trend of the QQQ remains up. IBD still sees the market in a correction. This is a news driven market, responding to each change in the U.S. approach to Syria and the looming U.S. budget actions in Congress. And September is the worst month for the market. However, the Worden T2108 is at 23%, very close to the area where bottoms occur. And the daily 10.4 stochastics is quite low, at 23. It too, is at a level where bounces often occur. This is the time for me to be largely out of the market in my trading accounts.
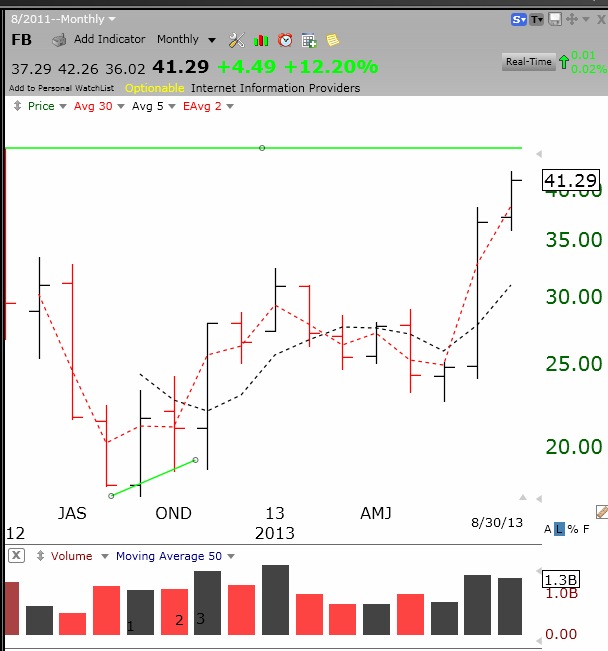
I did run my new high and good earnings scan and came up with 6 stocks: JAZZ, ATRO, NXPI, RNET, SPLK, BLOX, FB. I own a little of FB. If FB can close above its all-time high of 45, I will buy this green line break-out. I have noticed that an IPO (newly public stock) that forms a multi-month (green line) top and then closes above it, is often a terrific buy signal. Note this monthly chart of FB, with the green line top drawn in at its all-time high, reached in May, 2012. Note also the higher volume the past two months as FB climbed. To learn more about the usefulness of green line break-outs, view my free Worden Houston webinar from December, listed to the right of this post.