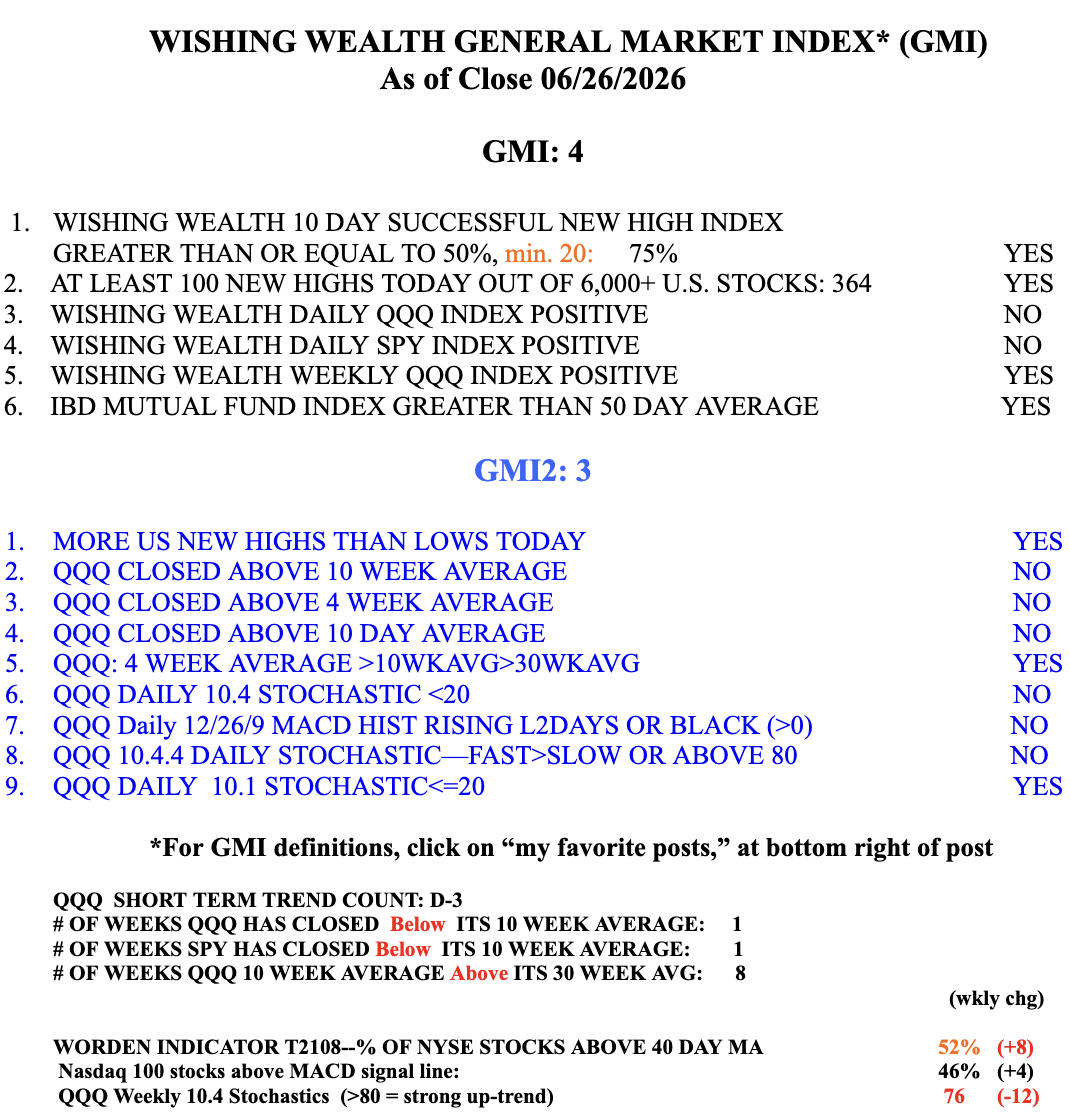
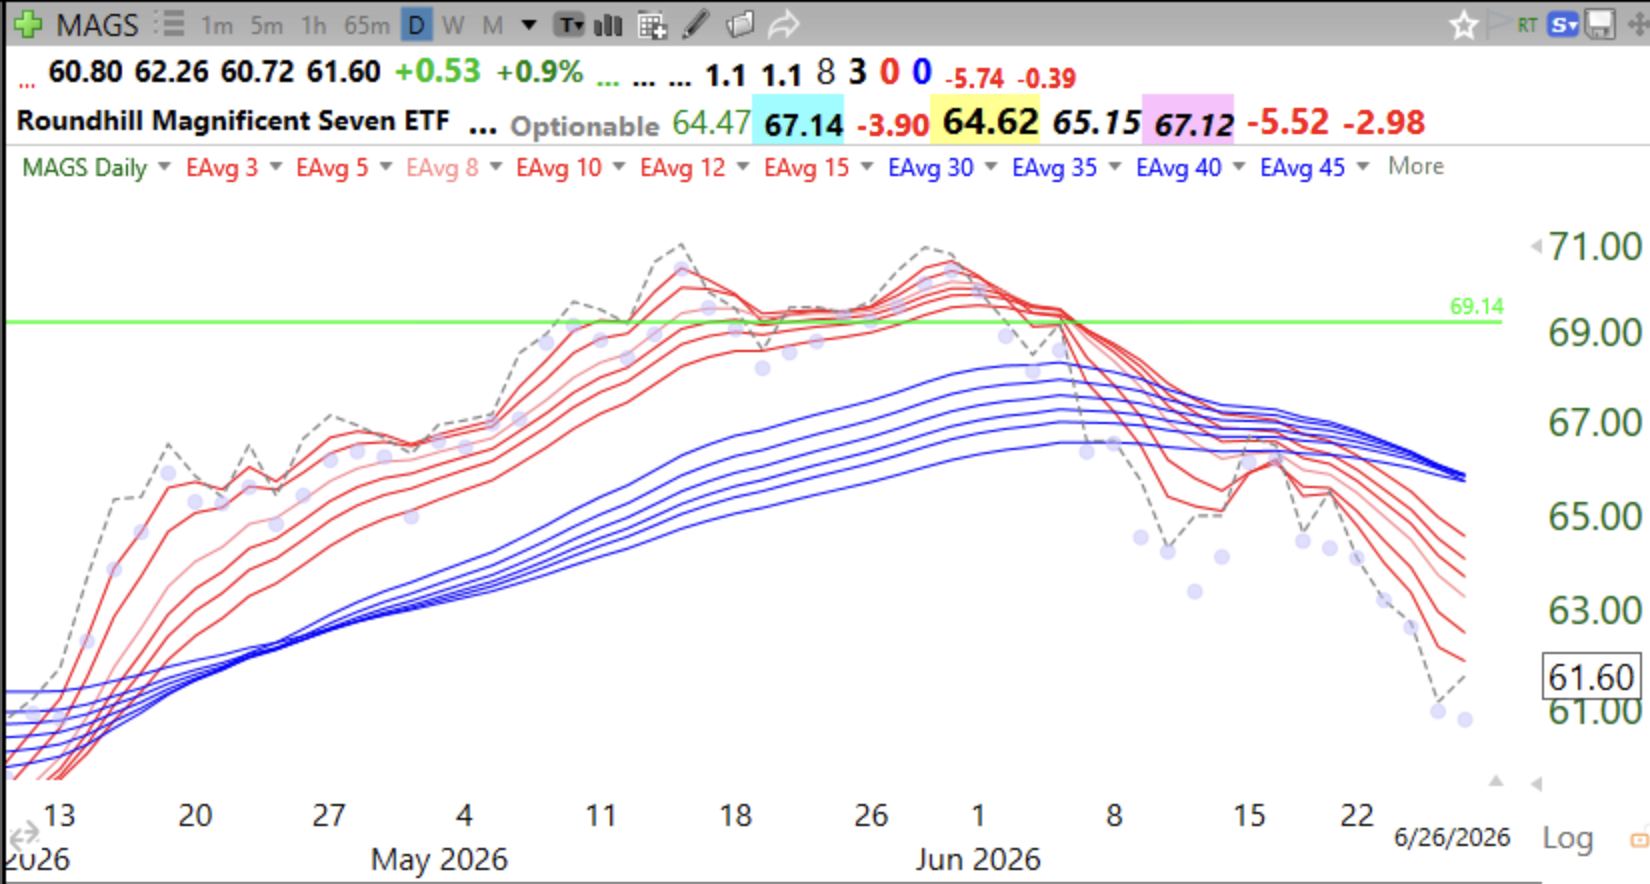
The growth stocks that drove this market higher are now faltering. The Mag 7 stocks are in decline, as shown by their ETF, below. On the other hand, there were 364 new 52 week highs among US stocks on Friday, the most since last February. I suspect the growth stocks have had their ride and the remaining stocks are topping out now. They usually shoot the generals first. I suspect we might see one last market rise when second quarter earnings come out, at least among stocks who report great earnings. When growth stocks that report great earnings don’t go higher, it is a sign of danger. And the Fed may be about to raise rates. I own a little SQQQ and GLD, which recently bounced from very oversold, see chart.
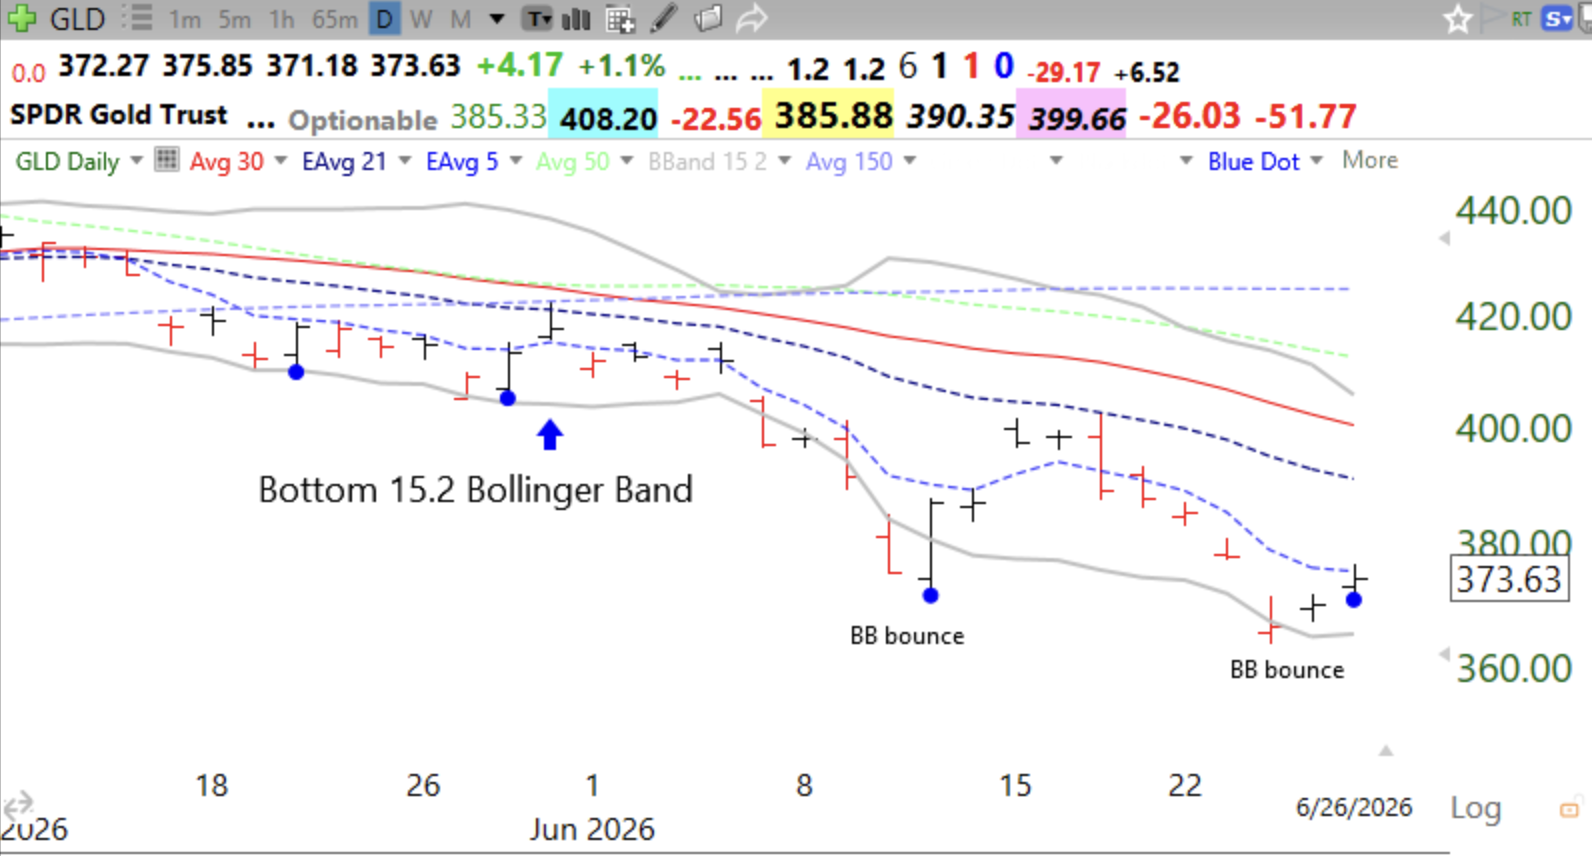
GLD has bounced from its bottom 15.2 Bollinger Band and also had a blue dot, oversold bounce.
The GMI=4 but the 10.4 weekly stochastic is now below 80.