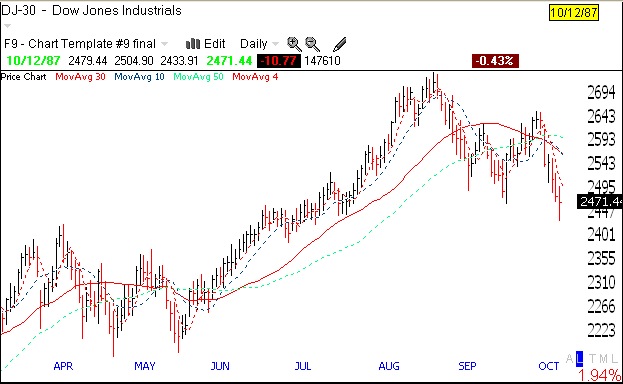
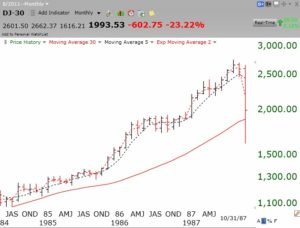
Mark Hulbert recently published an article saying that another 1987 type crash is inevitable. I am a firm believer in the hypothesis that major stock market declines are largely precipitated by rises in interest rates caused by Fed tightening and slamming on the economic brakes. This article shows that interest rates were indeed rising for months before the October 87 crash. Also note that the 87 crash came after a super hot market rise. The monthly chart below through October, 1987, shows the Dow had more than doubled since July, 1984, and was up about 45% since the end of 1986 alone. Market declines tend to come after “irrational exuberance,” accompanied by rising interest rates.
I was fortunately out of the market during the 1987 debacle, having reacted to a weak technical pattern I saw in GM stock. At that time the popular slogan was that as GM goes, so does the U.S. economy. Given my subsequent experience with technical analysis, I looked back to see if my current indicators indicators would have warned me of the coming crash. I do this to assure myself that if another 87 type of crash comes my way, as Hulbert predicts, that I will be able to protect myself. So here goes.
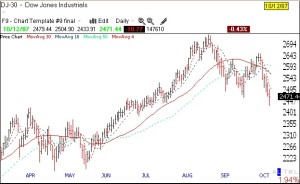
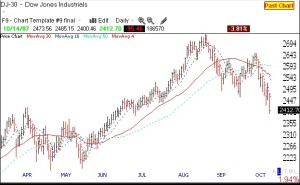
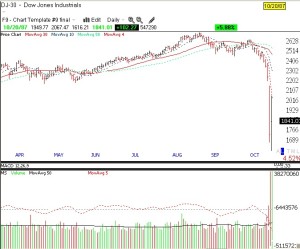
By October 12, 1987, the Dow had already declined almost 300 points to near 2471, from a prior high of around 2746. Note that the 30 day moving average of closing prices (red line) had already curved down. Note also that during the rise from June to August, the Dow remained nicely above its rising 30 day average. Note also the failed rally attempt in September where the Dow retook its 30 day average only to retreat. Using my current techniques, by this time, I would have already declared the Dow to be in a short term down-trend. (Click on charts to enlarge.)
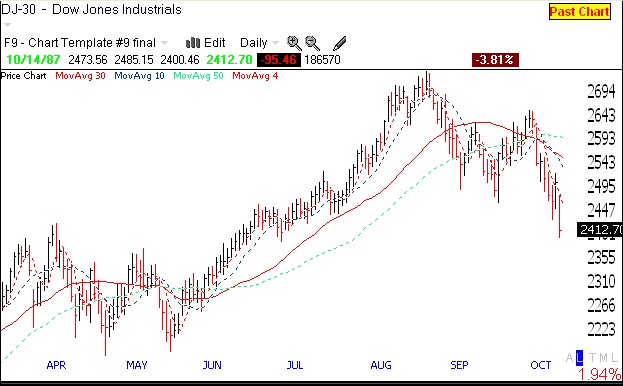
The market then rallied for a day and the next day it went to a lower low.
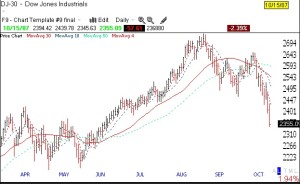
 Remember, these warning signs occurred before the crash. We then got another larger decline to 2355, again before the crash. Given all of the lower lows and the declining moving averages, I like to think I would have already taken a lot of $$$ off of the table. Remember, by now I would be declaring an extensive multi-week short term down-trend.
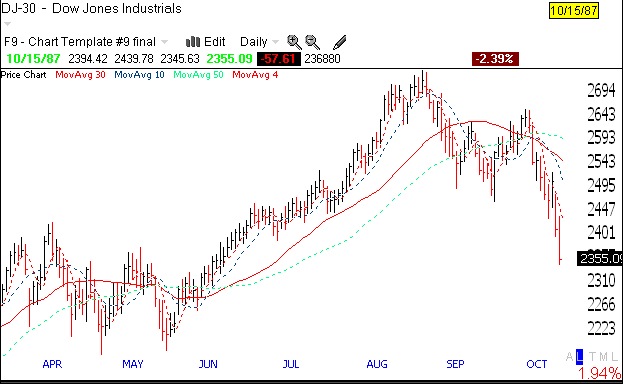
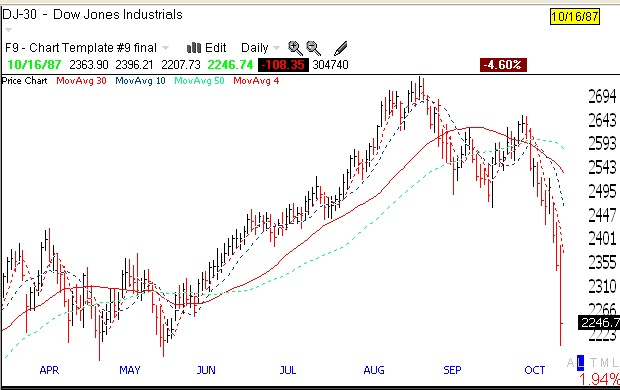
 The next day, still before the crash, the Dow fell another 108 points or 4.6%.
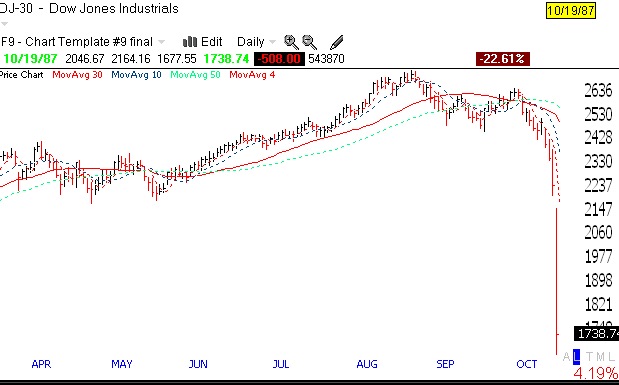
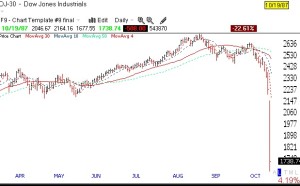
 Finally, we get the crash, down 22%—hardly out of nowhere! By my trend count model, the crash came on the 9th day of the new Dow short term down-trend, giving plenty of time to get out.
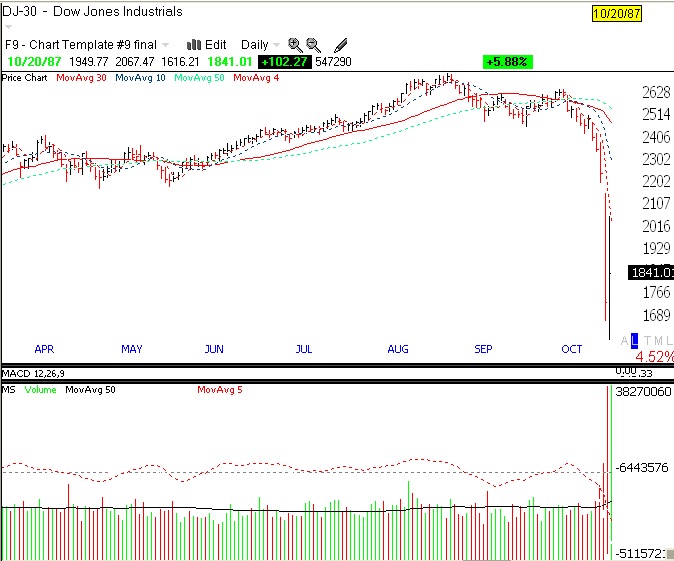
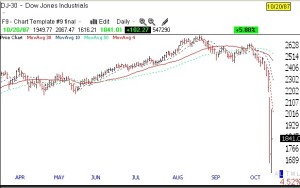
And the next day we got a bounce. Those who ignored the signs and had a “buy and hope” strategy probably finally sold out at the bottom.
 This chart shows you the huge volume of shares traded during the panic.
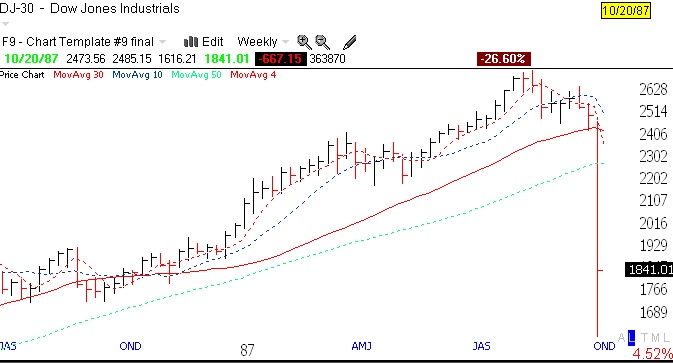
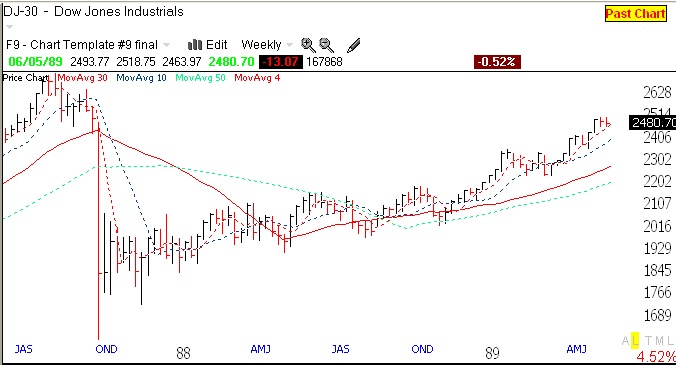
 If I had not exited the market based on the daily charts, I might have noticed the critical failure of the Dow to hold above its 30 week average (red line) , early in the decline.
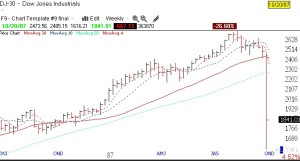 This weekly chart shows how, following stage analysis, I would have been alerted to a new Stage 2 up-trend in the summer of 1988.
 While hindsight is 20:20, I think you can see from the above that there were plenty of technical signs portending of a decline, long before the crash. If we blot out all of the media pundits and their exhortations to stay in the market, we can just let the market tell us what is happening. That is what I strive to do when I publish this blog. The fact that we are in a time of low interest rates and a steady but not irrational market advance suggests to me that we should not be expecting any 87 type of crash now just because it is its anniversary. Nevertheless, my indicators should alert me to any potential problems?!!
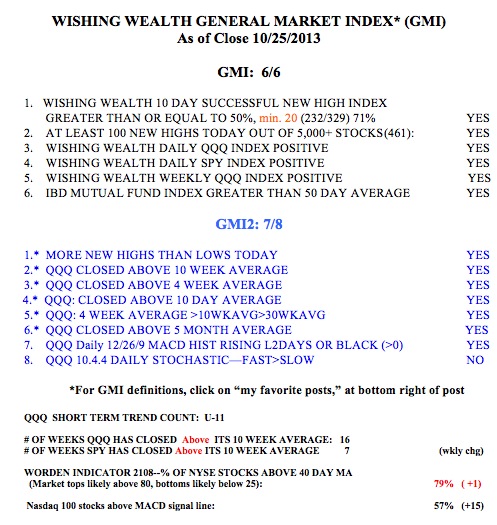
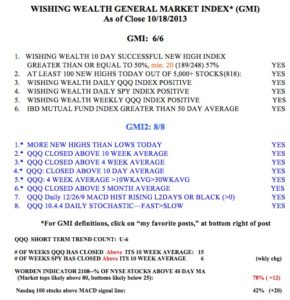
Meanwhile all of my indicators are positive, with the GMI at 6 (of 6) and the GMI-2 at 8 (of 8). Friday was the 6th day of the new QQQ short term up-trend. From the table below we can see that there were 818 new 52 week highs last Friday. The last time we had more than 800 new highs was November, 2010, at the beginning of a multi-month rally! Note, however, that the QQQ has closed above its critical 10 week average for 15 straight weeks. The Worden T2108, at 73%, is getting close to the area where it tops out, above 80%. Perhaps of most concern is that the Dow 30 Index has been much weaker. It has closed above its 10 week average for only the last 2 weeks. The SPY has done so for 6 weeks. I went back to look at how many of the Dow 30 stocks closed above their critical 30 week averages. The number is 20 or 67%. Key stocks below their 30 week averages include: KO, T, XOM, WMT, MCD, IBM and HD. On the other hand, 87% of the NASDAQ 100 stocks and 80% of the S&P 500 stocks closed above their 30 week averages. What is wrong with the blue chips?
I have a suspicion that we are seeing the beginning of the more speculative stage of the bull market. After a major decline, people buy the blue chips because they are scared to buy the more speculative companies and think that dividends will protect their portfolios. After the bull has been going for a while and people have profits, they become more confident of the bull and move on to the riskier companies. With the debt crisis over and Halloween buy signal approaching, people may be more optimistic and willing to take on the growth stocks.
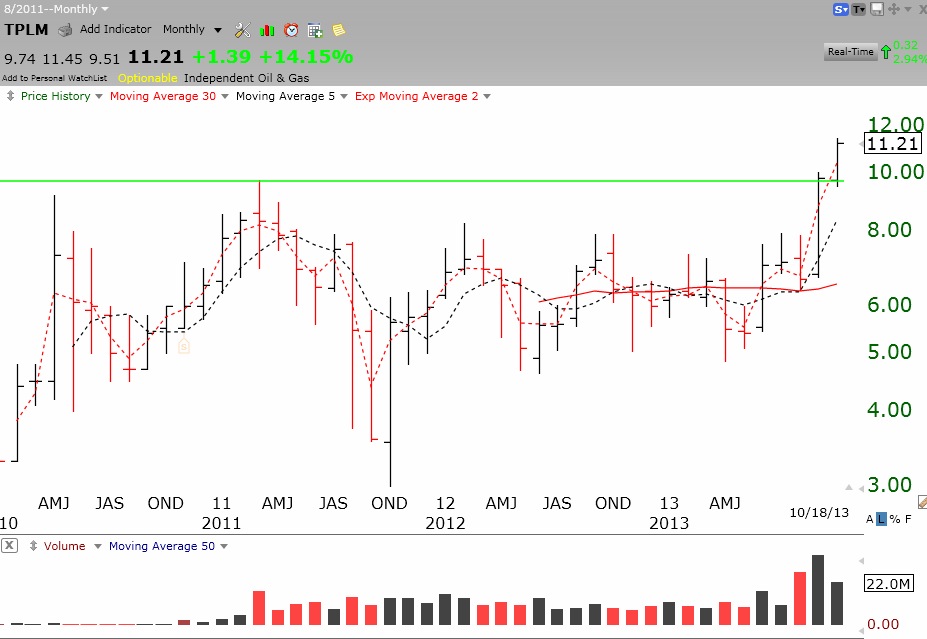
By the way, the monthly chart below shows that TPLM has had a recent green line break-out to an all-time high. TPLM has growing earnings and revenue. Check it out.

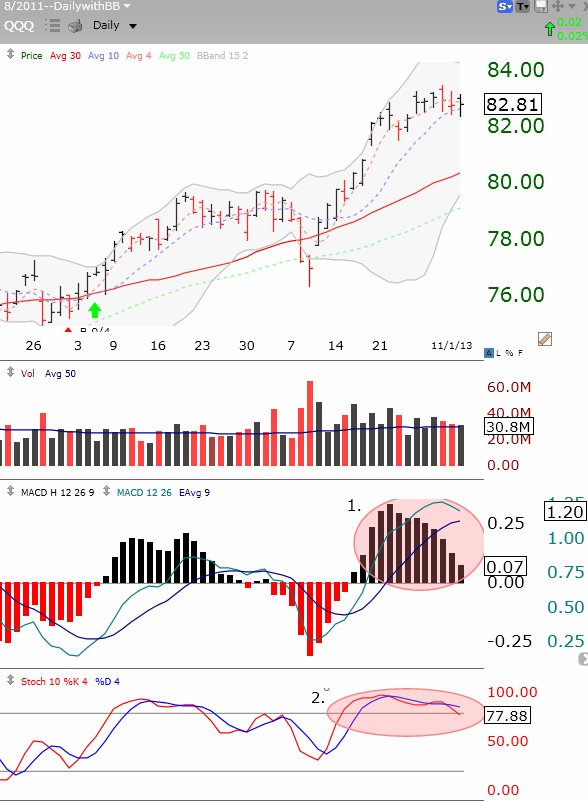 It does not mean that the QQQ short term up-trend will end, only that at least a brief consolidation may be coming……
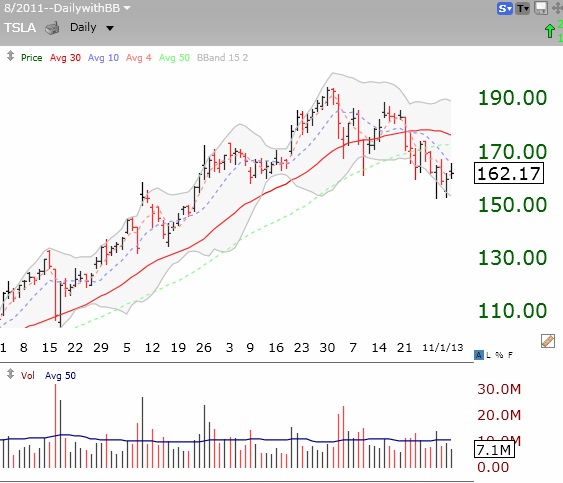
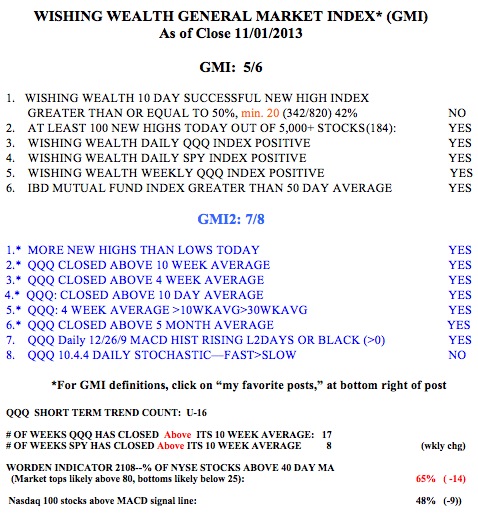 TSLA just found support at the lower Bollinger band that I follow (15,2). But it is below its declining 30 day average (red line). Will this level hold when earnings are released on Tuesday? TSLA closed at 162.17 on Friday. November 8, 160 weekly calls are expensive, at around $10.75. Break even on these calls would therefore be at $170.75 (160+10.75) , excluding commissions. Can TSLA break 170.75 by Friday? Stay tuned….