It is noteworthy that the IBD market pulse claims the market up-trend to be under pressure. My GMI is now 3, indicating a market trend that is midway between up-trend and down-trend. Nevertheless, with my QQQ short term trend count now turning down, I am taking money off of the table. My university pension assets are double what they were at the 2009 bottom and I am unwilling to give much of it back. I have transferred about half of my mutual funds to money market funds. I will sleep better knowing that I have protected money that I will need for retirement. (I am a chicken!)
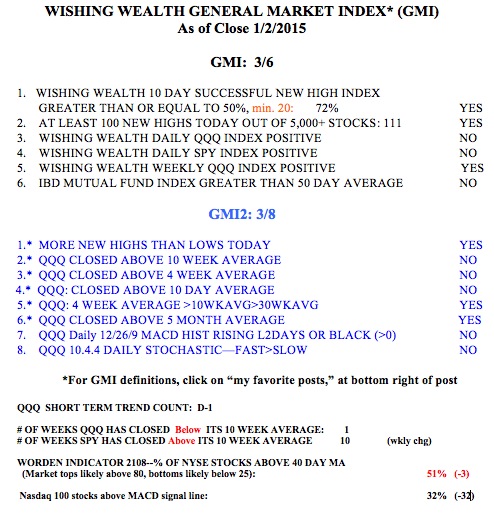
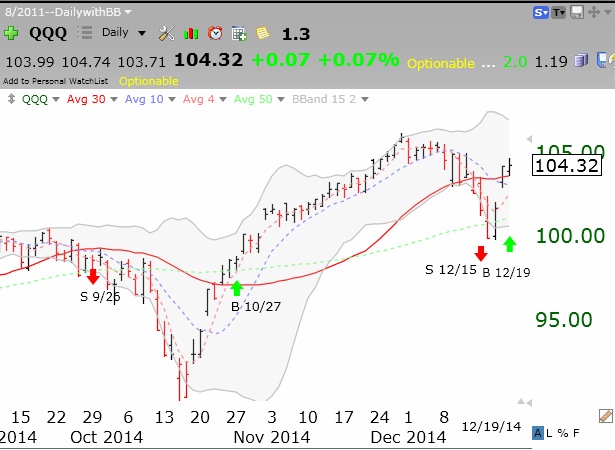
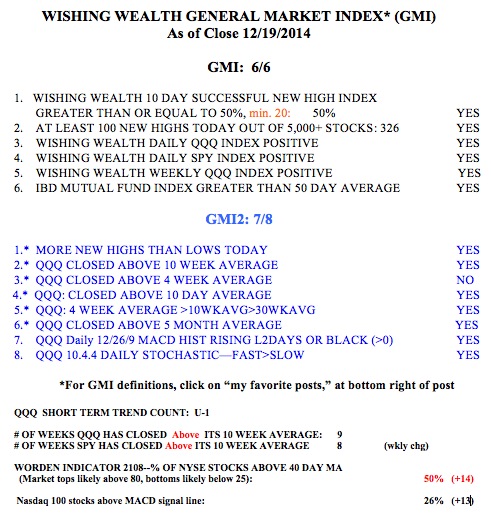
I am hedged, long and short in my trading IRA, however. I own inverse ETF, SQQQ, which is designed to rise 3X the amount that QQQ falls. If the QQQ short term down-trend ends quickly, I will exit my position in SQQQ. There are other storm clouds on the horizon. The QQQ has now closed below its critical 10 week moving average. In the past I have found it very difficult to make money on the long side when this was so. The fact that the IBD Mutual Fund Index is also below its 50 day average (a component included in the GMI, see below) suggests to me that the pros who invest in growth stocks are having trouble…..
A lot of people are married to AAPL. It is the one stock that people seem to think is safe. Over the years I have found that as long as AAPL closes above its 10 week average it is profitable to hold. Growth stocks should remain above their rising 10 week averages. I tend to get into AAPL when it closes above its 10 week average and to exit when it closes below. Well, AAPL has now closed the week below its 10 week average. The weekly chart below clearly illustrates this. AAPL may quickly regain its 10 week average as it did last October, and then again it may not…..
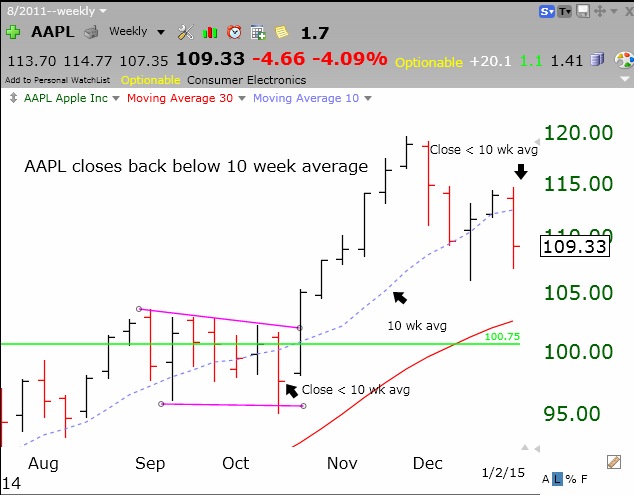
AAPL has a lot of company below the 10 week average: TSLA, GOOG, AMZN, BABA, NFLX, PCLN, GMCR to name a few. They typically shoot the leaders first.
The GMI remains at 3 (of 6). Two consecutive daily closes below 3 would trigger a GMI Sell signal. Note that the SPY remains above its 10 week average–for now.