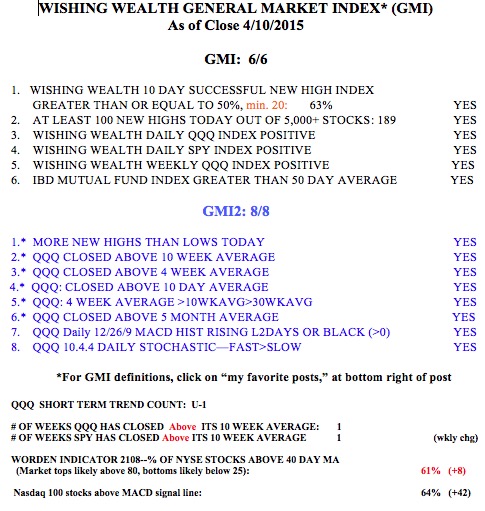
All of my GMI and GMI2 components are positive. The QQQ and SPY have now closed back above their 10 week averages. Time to trade on the long side again, at least until earnings season is over.
Stock Market Technical Indicators & Analysis
All of my GMI and GMI2 components are positive. The QQQ and SPY have now closed back above their 10 week averages. Time to trade on the long side again, at least until earnings season is over.
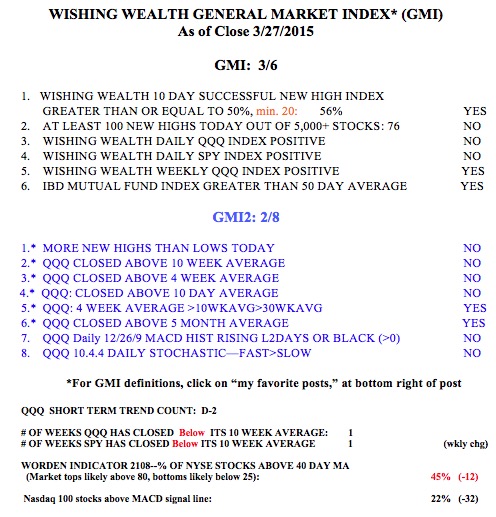
With the GMI stuck at a middle 3 reading (see table below), I thought it might be useful to analyze the Dow-30 stocks according to the patterns I have been writing about that use a modified GMMA chart. 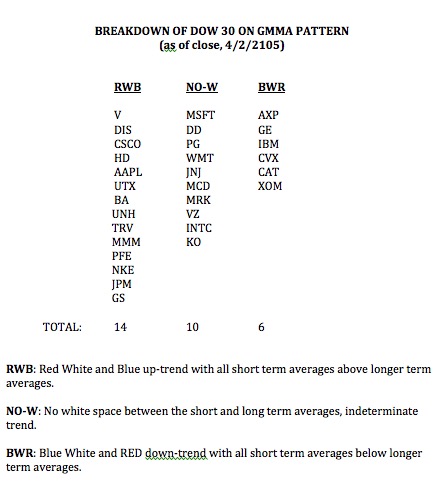 It is noteworthy that a little less than one half (14) of the Dow 30 stocks remain in a strong RWB up-trend. Ten stocks are too close to call with their 6 red short term exponential averages overlapping with their 6 blue longer term averages such that there is no white space between the two sets of averages. Finally, six stocks are in solid BWR down-trends with all of their shorter term averages well below their longer term averages. I only want to own stocks showing RWB patterns because they are in strong up-trends. BWR stocks are for shorting, and I would never hold any of them long. The fact that about one third of the Dow 30 stocks are in No-W patterns (no clear up or down-trends) could signify a market in transition. I provide an example of each pattern below.
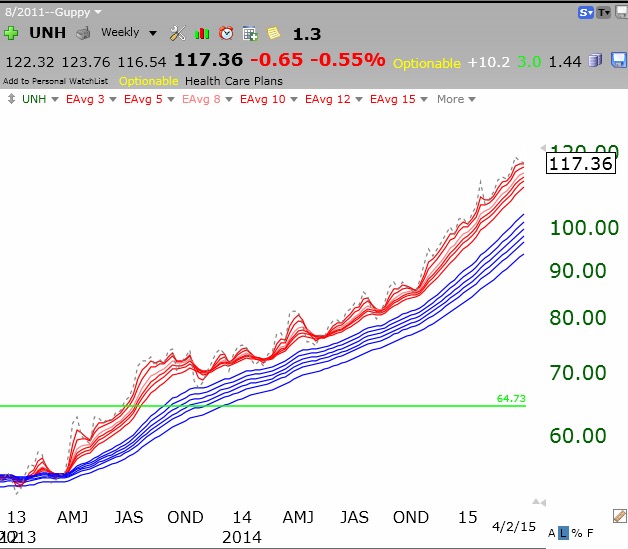
RWB up-trend: UNH
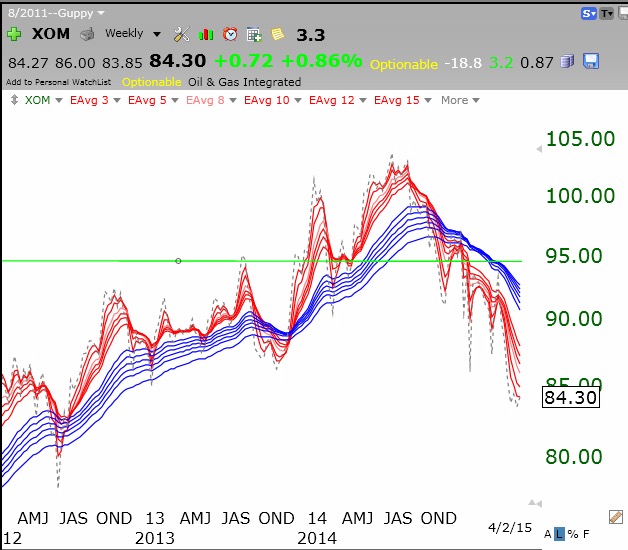
 BWR down-trend: XOM
No-W, indeterminate trend: JNJ
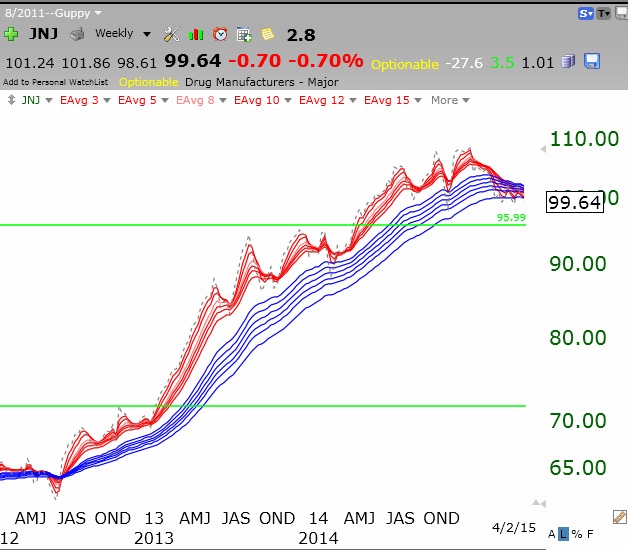 It is possible JNJ (and the other 9 N0-W stocks) is in the process of transforming from a multi-year RWB up-trend to a BWR down-trend, like XOM did in 2014. Only time will tell…………
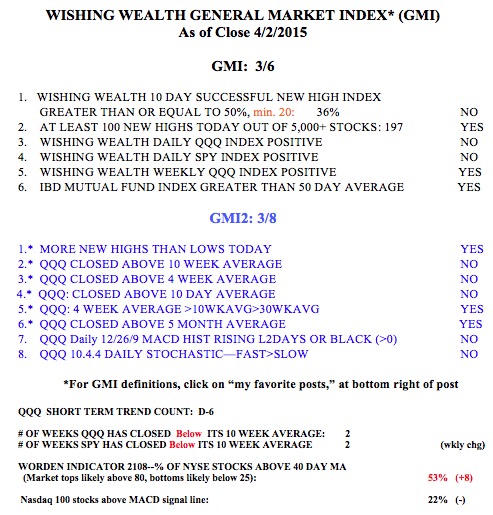
The GMI rose to 3 on Friday (see table below), keeping the January Buy signal in place. Nevertheless, Friday marked the second day of the new QQQ short term down-trend. A good many of these short term down-trends since 2006 lasted under 5 days. I think it likely that we have finished with the customary pre-earnings lull/decline period and that the market will rise as we move into first quarter earnings reporting.
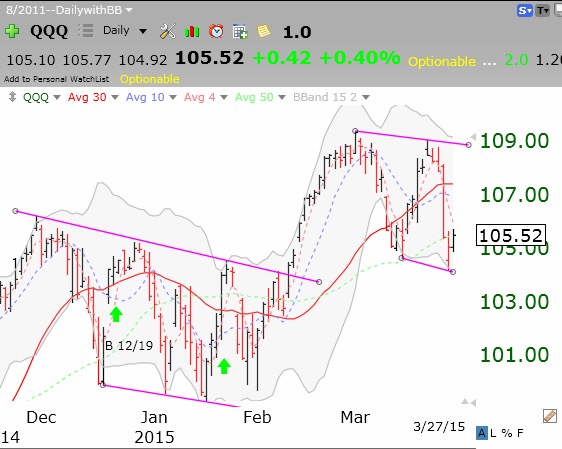
This daily chart of the QQQ suggests to me that the market may be in another trading range like the one we experienced in December and January. I have marked these ranges with trend lines. The market bounced on Thursday above its bottom daily 15.2 Bollinger Band. I would have liked a more oversold reading on its daily 10.4 stochastic- it only reached a low of 34. Thus, either the recent BB bounce will hold, or the QQQ will retreat again to an oversold stochastic, below 20. The market indexes tend to bounce back after the daily 10.4 stochastic declines to below 20. (Click on chart to enlarge.)
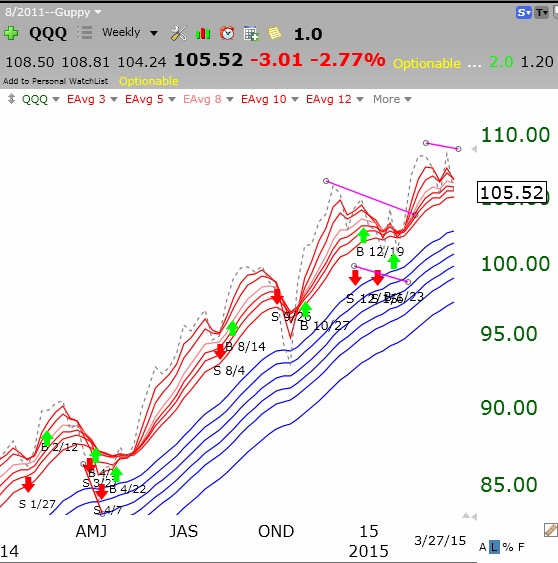
This weekly GMMA chart of the QQQ shows this index to be in a strong RWB up-trend.
With the GMI at 3 on Friday, my indicator remains on the Buy signal from late January.