All indicators remain positive; GMI based strategies lead to large gains in 2012 and 2013; ONVO soars

GMI6/6
GMI-28/9
T210859%

The Dark Liquidity site has been comparing the GMI   based trading strategy versus a number of other strategies.   For each of the last two years a strategy that bought the QLD whenever the GMI signaled buy, and went to cash every time it signaled sell beat all other strategies followed.   In 2012 the GMI based QLD strategy was up about +30%   and thus far in 2013 it is up +42%.   I do not check that site’s computations, but my experience is that repeatedly, buying QLD when the GMI signals buy has usually worked.   Since the last GMI buy signal on September 4, the QQQ is up 9.3%, the SPY is up +8.5% and the QLD is up 19.5%.   For those willing to trade TQQQ, the speculative 3X leveraged QQQ bullish ETF, it is up +29.9% in the same period.   While past performance does not guarantee future results, it is striking to me that I have found and posted   similar results for prior up-trends signaled by the GMI.

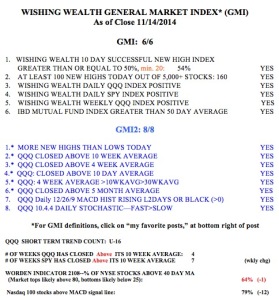
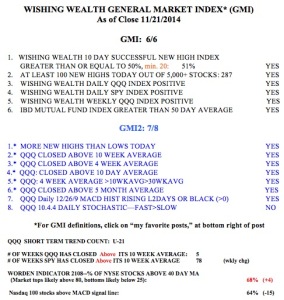
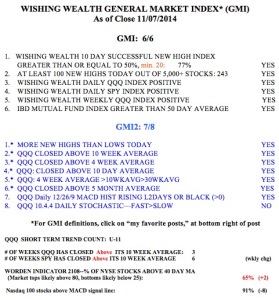
With that as an introduction, here is the current GMI and its components. After a down-trend, two days with the GMI above 3 signals a buy and two days below 3 signals a sell. I continue to post the GMI signals to the right of this site. I would be interested in hearing from my readers whether they have been able to trade successfully based on the GMI.

GMI11152013

For those following ONVO, it had its highest trading volume ever, 26 million shares, on Friday. With the stock going near vertical, it is very dangerous.   But it did burst through its green line top! When I first posted about it when it was around $4, I warned that it was like buying a lottery ticket.   It still is…..

ONVO11152013


Market at critical juncture; MACD and Stochastics weakening; What will TSLA do–buy a call?

GMI5/6
GMI-27/9
T210865%

This is the time when the Sell in May crowd should be returning to the market.   But sentiment is very bullish, with few bears to be seen. And my nieghbor, a great contrary indicator, is now looking to get back into the market.   The last time he was so excited and wanted to take out a home equity loan to invest was near the 2000 top. To be sure, there are no technical signs of a top yet. But it is possible that we will get some weakness the next few weeks now that earnings are largely out.   Let’s see if TSLA rebounds when earnings come out on Tuesday.   A number of high flyers have hit air pockets recently , including CMI, SAM, SRCL, ROP, ORLY, NVO, PRAA, and LNKD.

There are a number of technical signs suggesting at least short term weakness.   Take a look at this daily chart of the QQQ. I highlighted two areas of concern. Area 1:   The daily MACD is showing weakening momentum with the possibility that the histogram will turn negative.   Area 2. The fast daily stochastics has turned below the longer stochastics.   Both of these indicators   are showing weakening strength in the up-trend. (These indicators paint a similar picture for AAPL, not shown.)

QQQ11032013It does not mean that the QQQ short term up-trend will end, only that at least a brief   consolidation may be coming……

Meanwhile the GMI is at 5 (of 6).   However, note that the QQQ has closed above its 10 week average for 17 weeks.   That is a long time.   The Worden T2108 is at 65%, down from a high of 82% reached on 10/22.

GMI11012013TSLA just found support at the lower Bollinger band that I follow (15,2).   But it is below its declining 30 day average (red line). Will this level   hold when earnings are released on Tuesday? TSLA closed at 162.17 on Friday.   November 8, 160 weekly calls are expensive,   at around $10.75. Break even on these calls would therefore be at $170.75 (160+10.75) , excluding commissions. Can TSLA break 170.75 by Friday? Stay tuned….

TSLA11032013