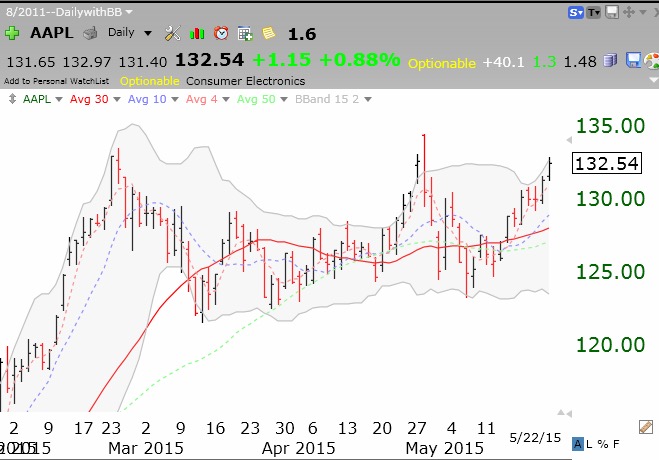
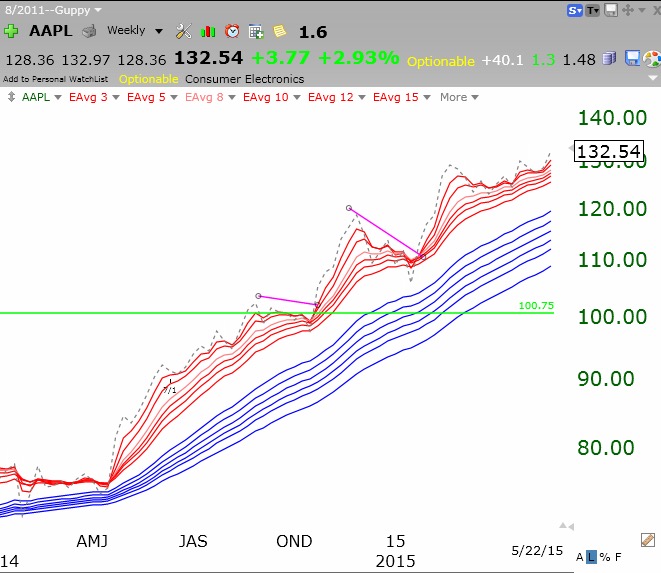
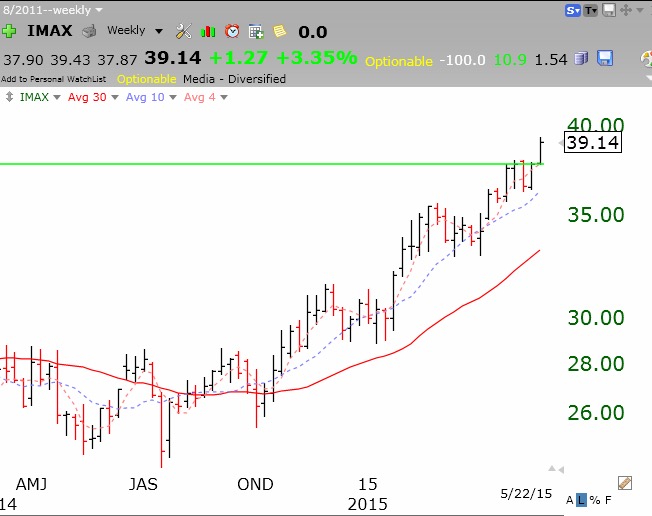
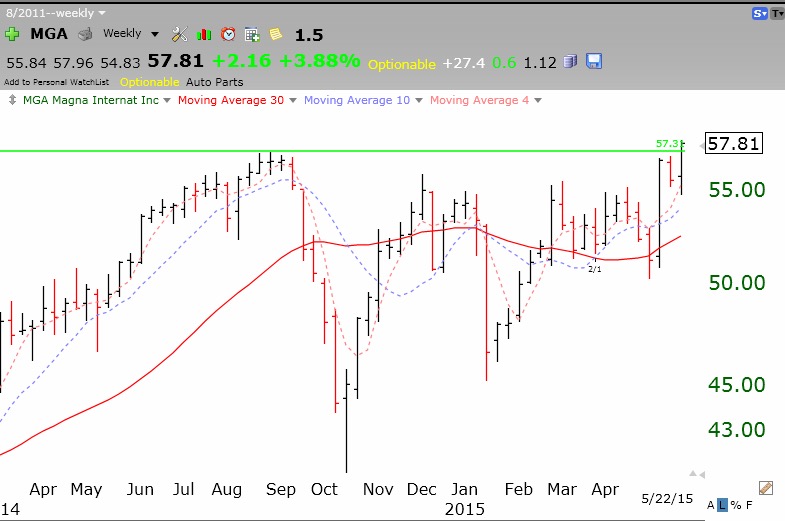
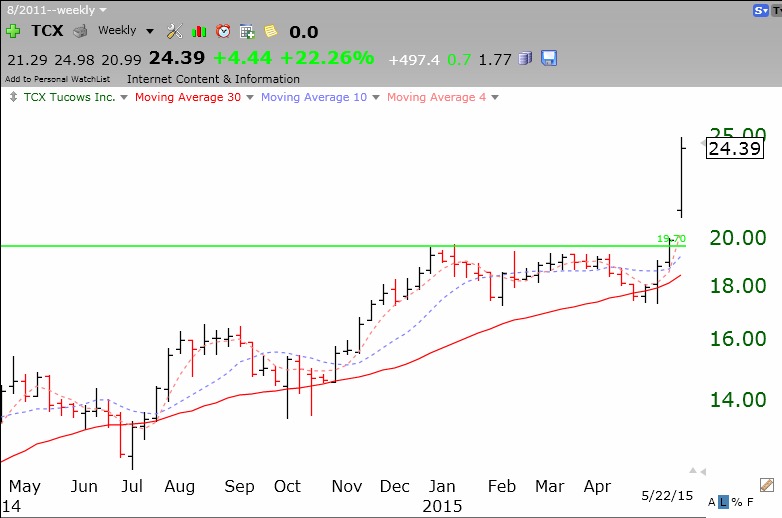
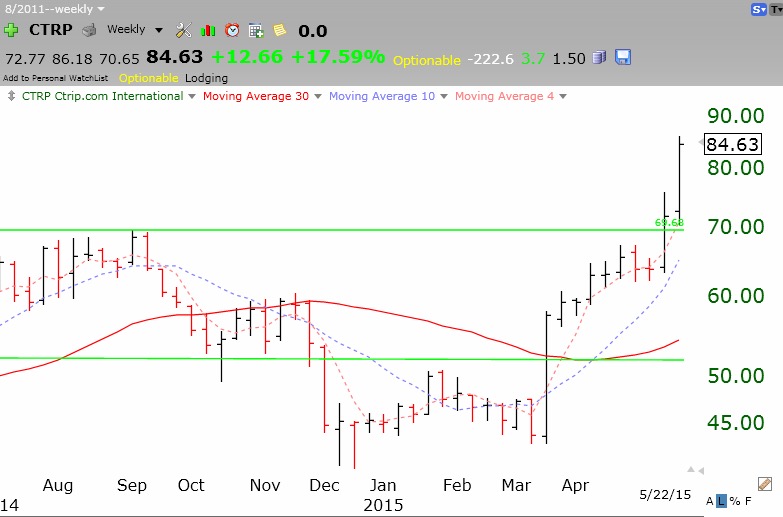
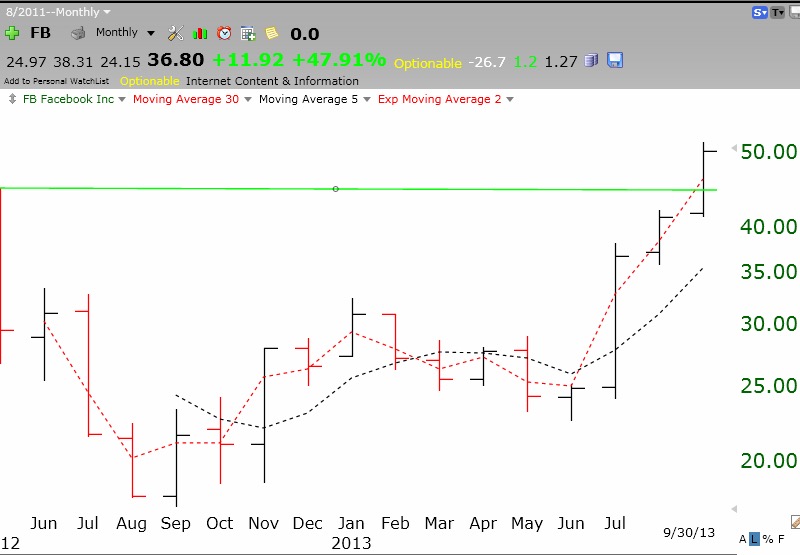
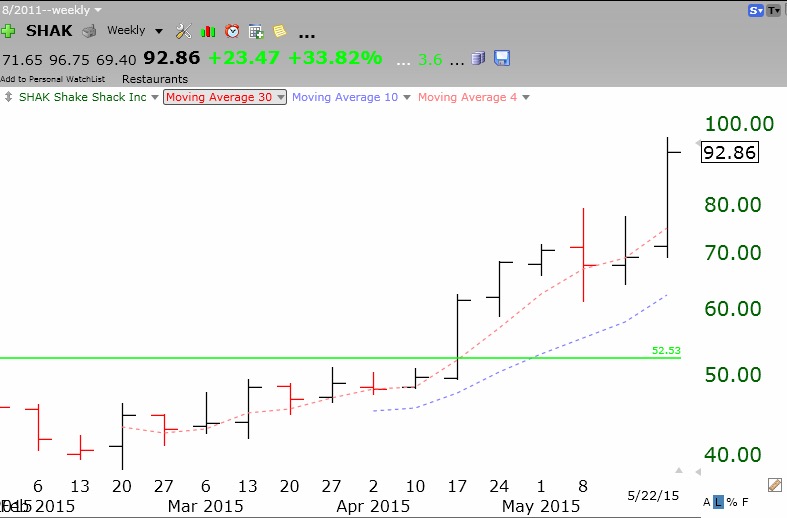
Some signs of short term weakening are appearing. First, a lot of my holdings were rapidly climbing. When that happens the market is often near a short term sell-off. Second, I find that the QQQ and AAPL are up against resistance and thus more likely to retreat than to advance. Lastly, I have noticed that the market tends to be strong at the end of the month and then weak at the beginning of the new month. I therefore took some money off of the table on Friday afternoon. I do not want to give back a lot of my recent profits.
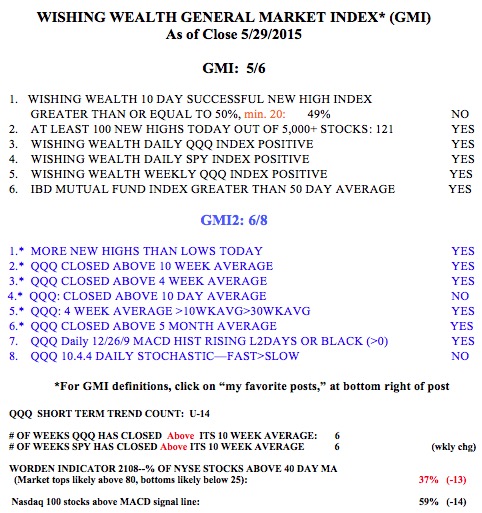
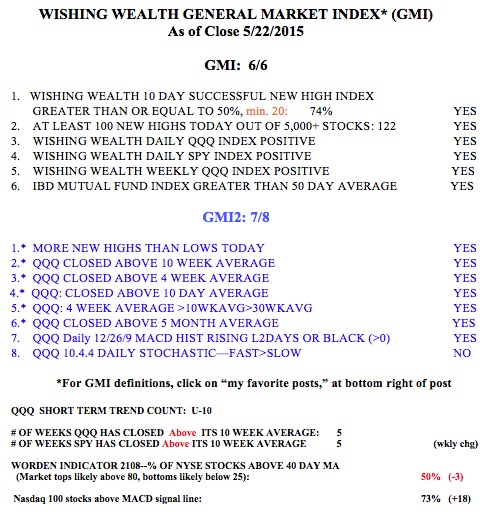
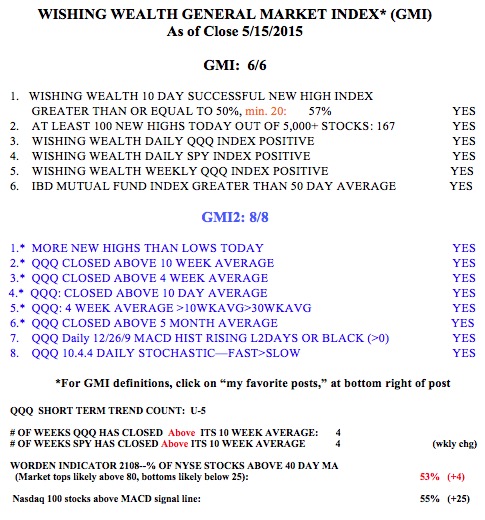
The GMI has now weakened a little to 5 (of 6) and the more sensitive GMI2 is at 6 (of 8).