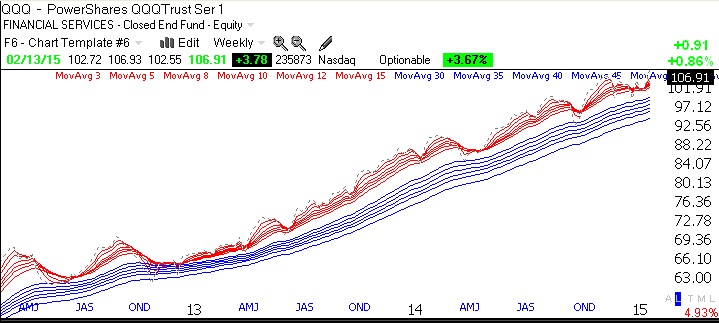
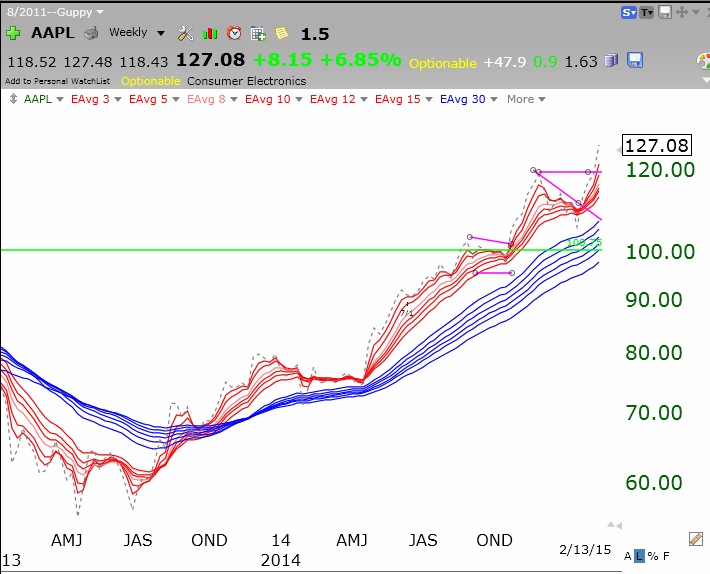
I have found that since 2006, the GMI has done a good job of keeping me on the side of the general market trend. It is my cardinal rule to trade consistent with the market trend. While the GMI has helped me to exit the market in prior major declines, I have discovered an important limitation while examining GMMA charts. From the GMMA chart of the QQQ below, I can see that since early 2014, the GMI has issued 7 separate Sell signals (red arrows) followed by 7 Buy signals (green arrows). However, during this entire time the QQQ has remained in a strong RWB up-trend, with all of the shorter term averages (red) above the rising longer term averages (blue)!
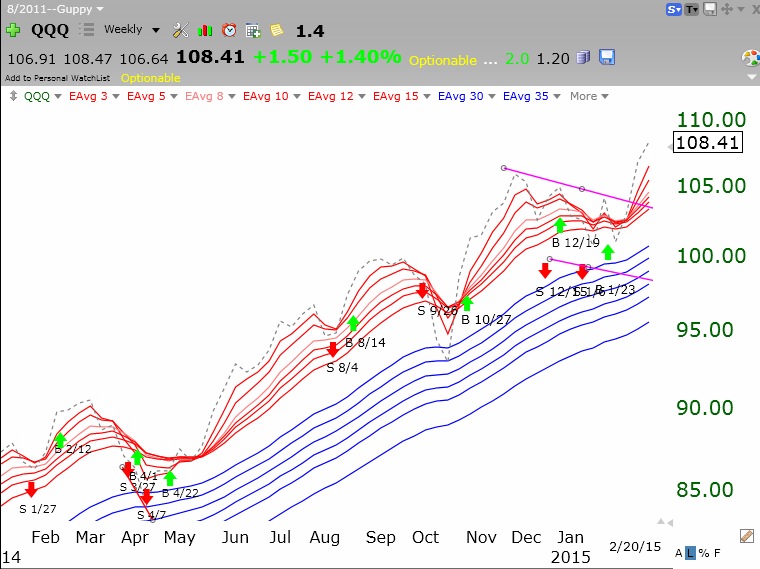 It is clear to me that a GMI Sell signal should only be used by me for short term trading decisions. Last week I posted that prior major market tops have been signaled when the shorter averages declined below the longer term averages. I should therefore probably remain invested long term in the market (at least in my university pension account) as long as the RWB pattern is in place, even when the GMI signals Sell. I am reinvesting my pension funds back into mutual funds. In the future I will use the GMI signals only to guide my shorter term trading in my more speculative accounts. I will heed the GMMA chart for longer term trends. One must never stop learning and adapting when it comes to the markets….
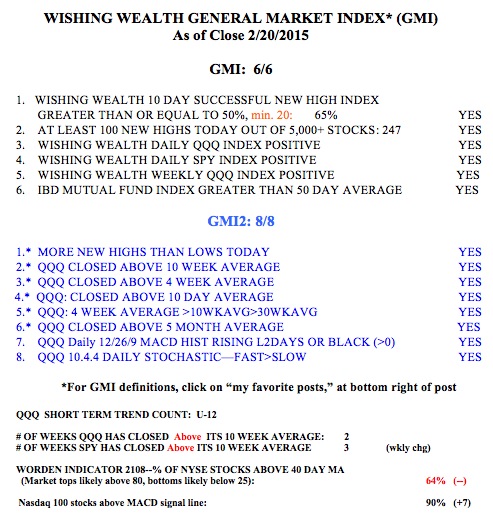
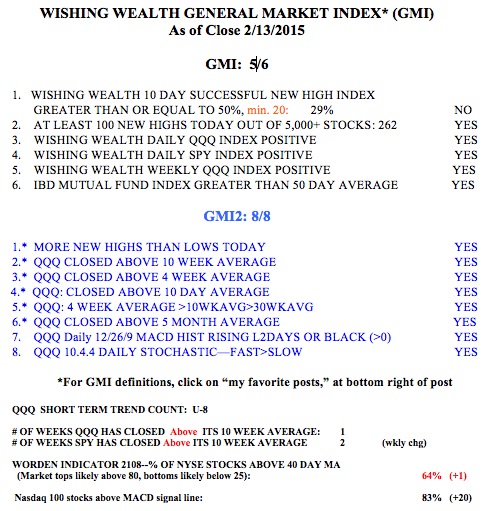
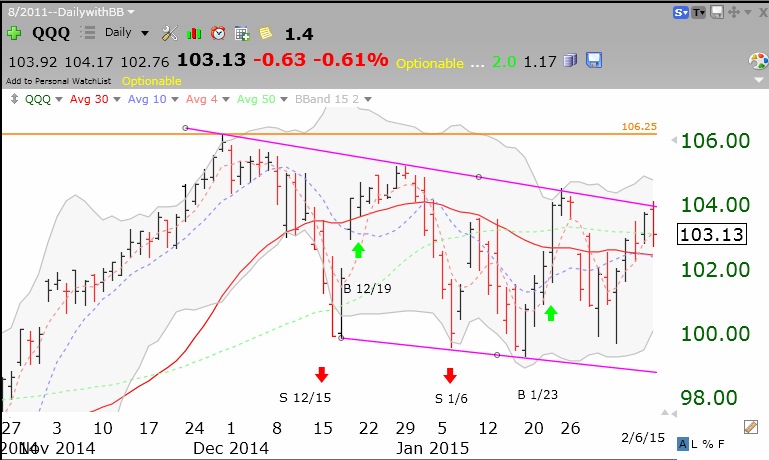
The GMI remains at 6 (of 6).