The famous J.P. Morgan, when asked what the market will do, responded with, “It will fluctuate.” Today we use the euphemistic term, volatility. Mr. market is driven today by extreme news events coming out of Greece and China. Do we really believe the Chinese government can permanently kill a panicked bear by suspending trading in one half of the stocks, and other ridiculous trading prohibitions that you may read about elsewhere? And then we have the Fed threatening to begin raising interest rates later this year. Put this together with the fact that this is an old bull market and we are nearing the season of market weakness, it is probably safer to pull back and conserve cash. But the market often rises as earnings are released.
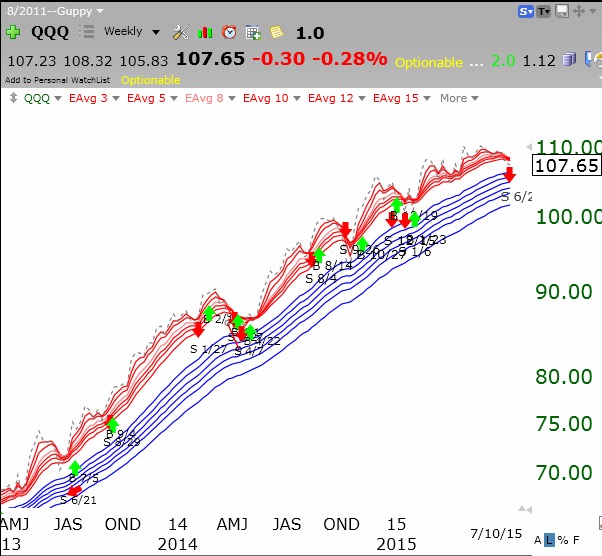
With that as a context, what are my technical indicators showing? The QQQ closed back above its critical 30 week average after being below it during the week. This was the 4th time that the QQQ has found support at this average since 2014. The 30 week average is the solid red line. The red arrows signify a GMI Sell signal and indicates that during this bull market one would have done well by buying stocks when the GMI issued a Sell. So we could get another rise from this week on. But if this rally should fail to break to new highs and breaks below last week’s low, look out below. Over a long multi-year period the GMI has kept me out of bear markets. I don’t mind exiting with a GMI Sell and going back in if the market rally resumes. This is a benefit of trading in a tax deferred IRA where I can go in and out without any tax consequences.
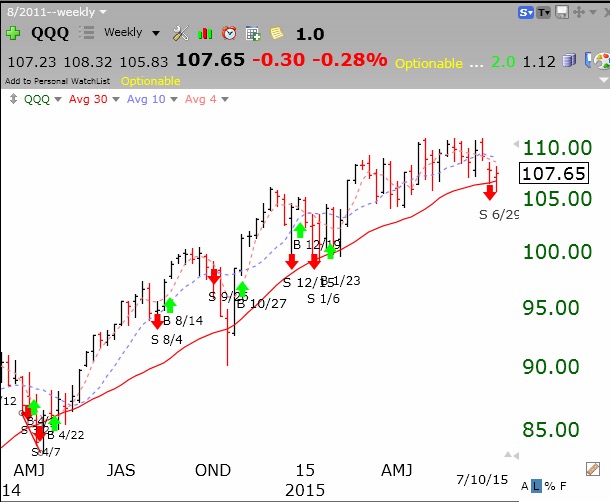 The GMMA weekly chart also shows a market still in an up-trend with an RWB pattern. Note the QQQ closed Friday below all of the shorter term (red) averages, as designated by the dark dotted line.
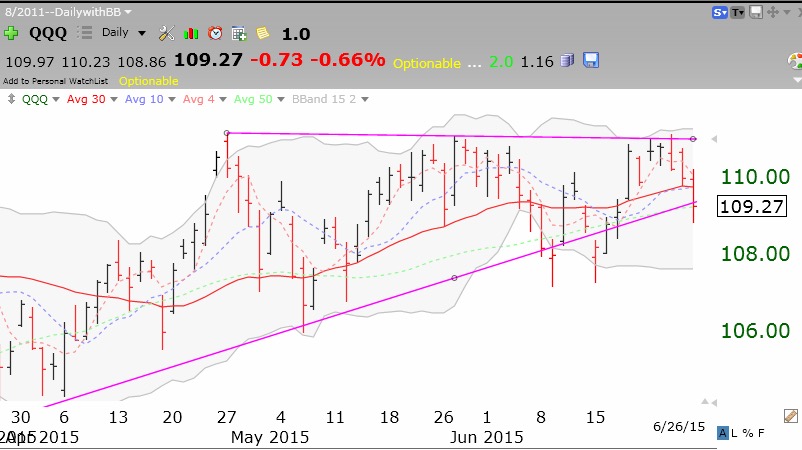
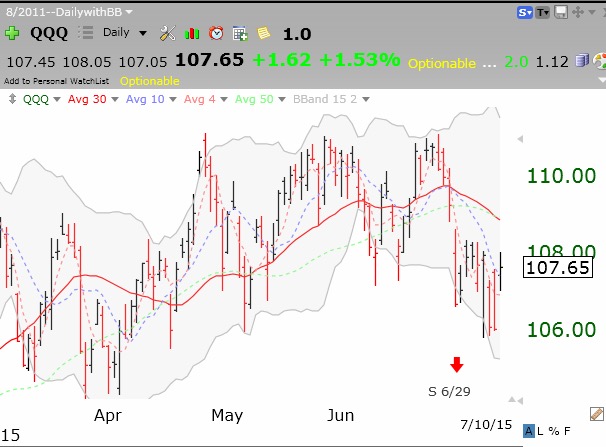
 The daily chart of the QQQ also shows a likely bounce from oversold levels. The QQQ Stochastics (not shown) recovered from an oversold level (<20) and the QQQ also bounced twice from its lower BB. It is a negative, however, to see the lower BB in a steep decline. A rally to 109, the level of the peak reached on March 20, would paint a very nice symmetrical triple top formation.
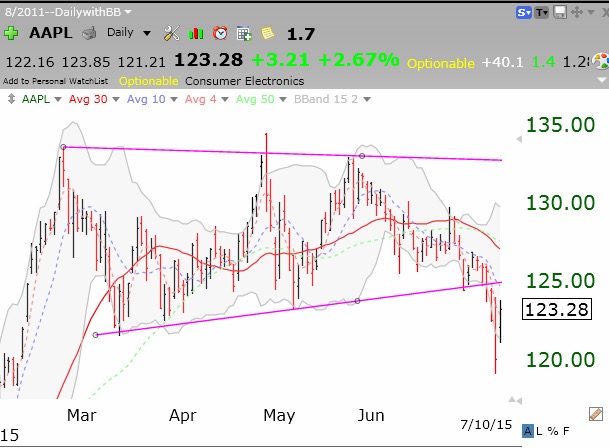
AAPL also regained its lower BB on Friday, but AAPL looks very weak to me. While we may get a rise into earnings, I would not trust it unless it breaks above the upper purple line to a new high.
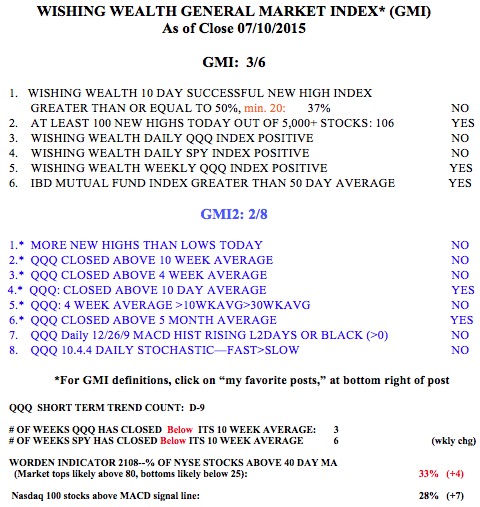
 The GMI remains on a Sell signal and Friday was the 9th day of the QQQ short term down-trend.