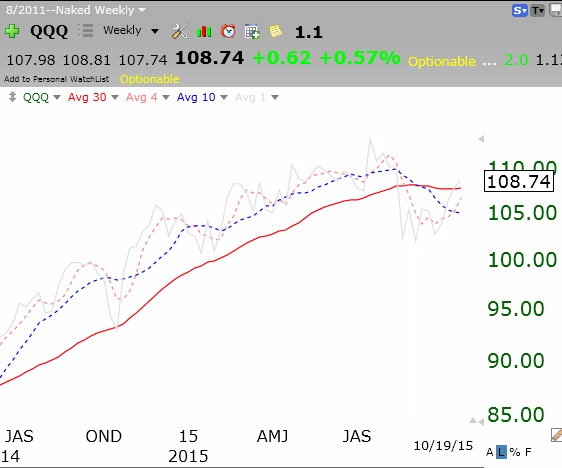
 The QQQ’s 10 week average (blue dotted line) is still below its 30 week average (solid red line). A sign of strength–the 4 week average (red dotted) has now crossed above the 10 week average. I remain on the sidelines, in cash.
Stock Market Technical Indicators & Analysis
The QQQ’s 10 week average (blue dotted line) is still below its 30 week average (solid red line). A sign of strength–the 4 week average (red dotted) has now crossed above the 10 week average. I remain on the sidelines, in cash.
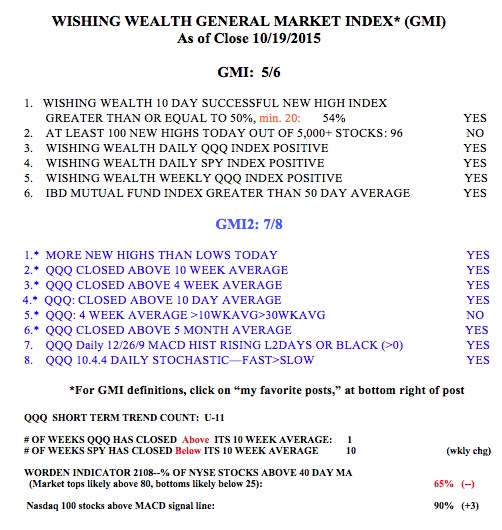
GMI may flash a Buy if Monday is strong. I am not ready to wade back into this market, however, until the QQQ retakes its 30 week average (red line), currently at 107.87. I also want to see its 10 week average (blue dotted line) back above the 30 week.
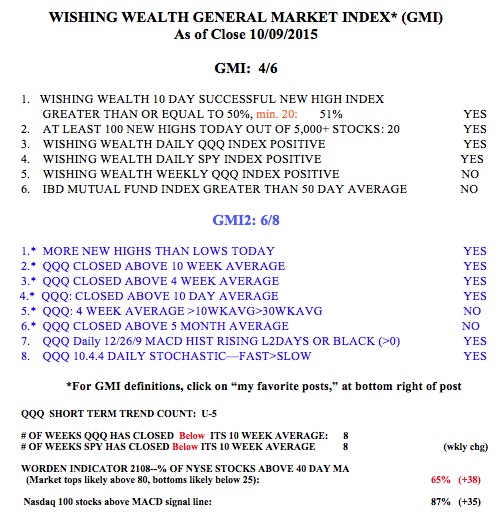
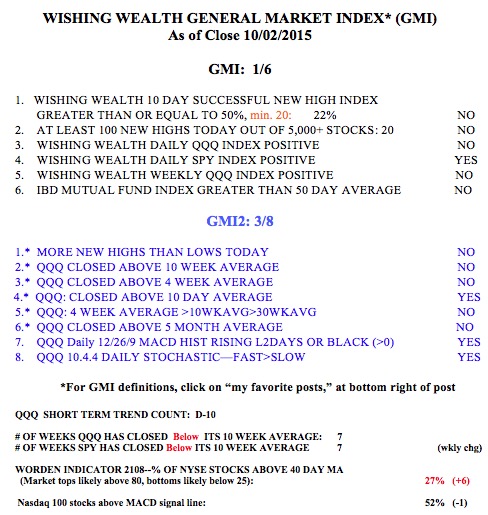
While the short term trend is now up, I do not have confidence in a change until it lasts 5 days. While this is a nice rally, the longer term trends are still down–for now. Here is the GMI table I should have posted yesterday. The T2108 zoomed to 45 on Monday.