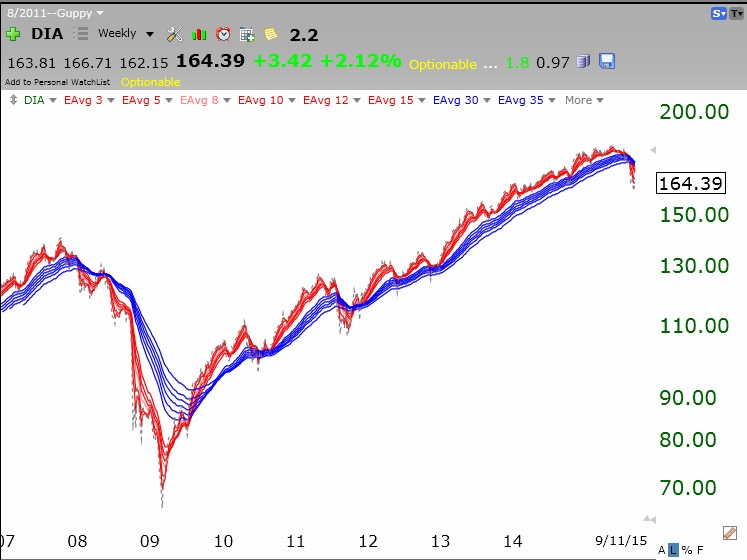
The major index ETFs I follow, DIA, QQQ, SPY clearly signal to me that a market down-trend has begun. An up-trending mrket should have the pattern of the 10 week average rising above the 30 week average. When the 10 week average falls below the 30 week average and the 30 week average turns down, that index is in a Stage 4 down-trend. Once a Stage 4 decline begins, one never knows how long it will last. I therefore exit the market and sometimes buy the relevant inverse index ETF. Take a look at the weak patterns of these ETFs in these weekly charts (the 30 week average is the solid red line, the 10 week average is the blue dotted line, and the 4 week average is the red dotted line). Click on charts to enlarge.
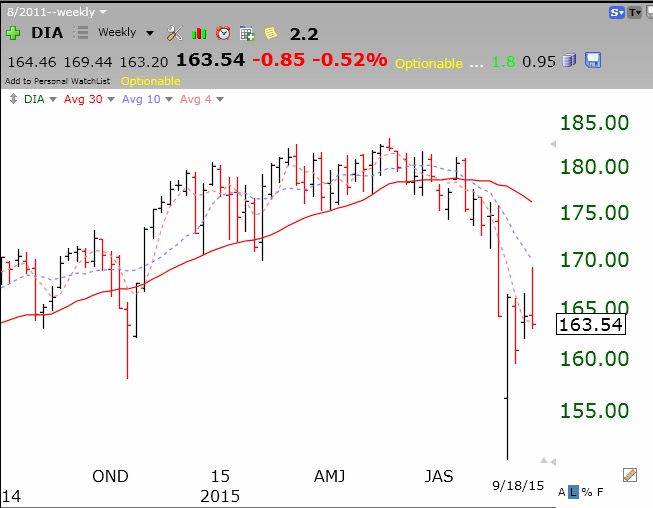
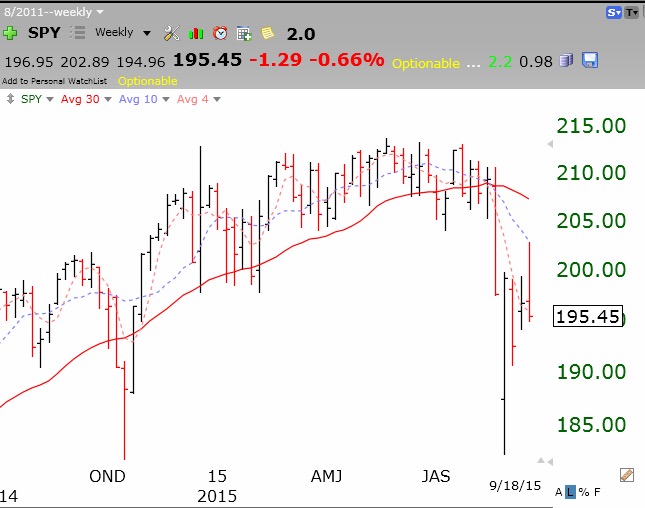
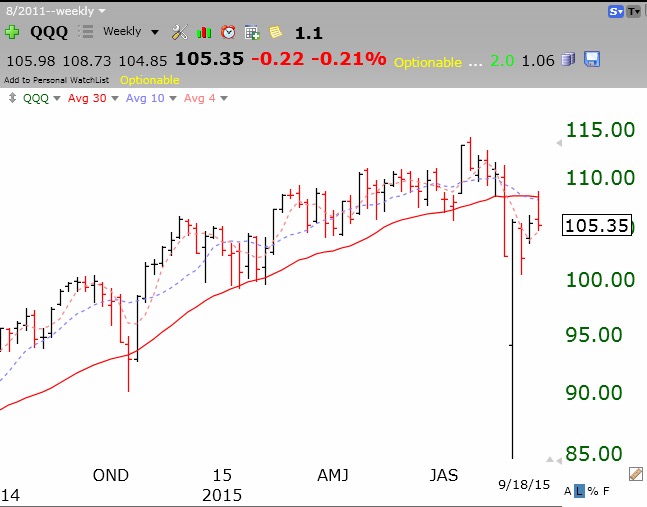
The DIA and SPY, which contain large multi-nationals, have the more pronounced declines underway. The QQQ, composed of many tech stocks, is now catching up (or down!) with the other indexes. These charts are exhibiting patterns similar to those that occurred at the beginning of the major declines in 2000 and 2007. These patterns got me out of the market early in those major declines and they are telling me to exit now. If the current declines are much more shallow than the others and I miss part of a rebound, that is fine with me. That is the cost of my insurance against a huge loss. There is plenty of time for me to re-enter the markets once the coast is clear and I am confident that a new Stage 2 up-trend has begun. Only a stock addict thinks s/he must always be in the game. (I trade in a tax deferred account and do not worry that selling out will trigger taxable events.) I will not fight the market tide. Once a down-trend begins, it is impossible to reliably predict how long it will last. Stay tuned……
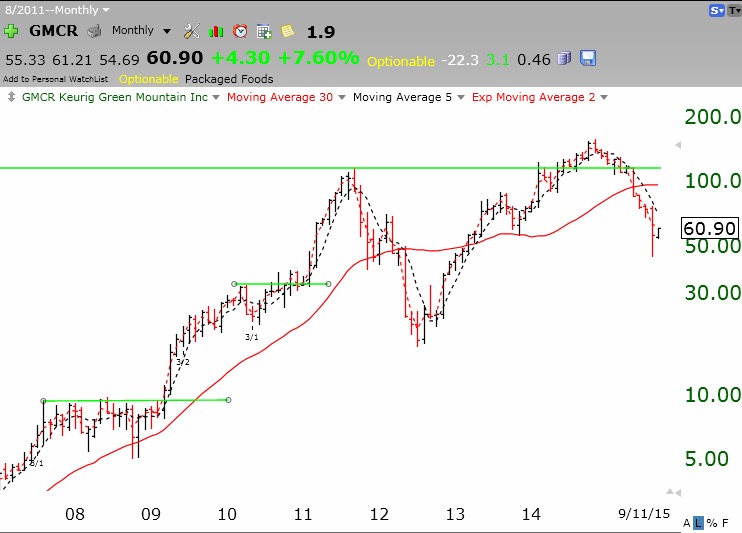
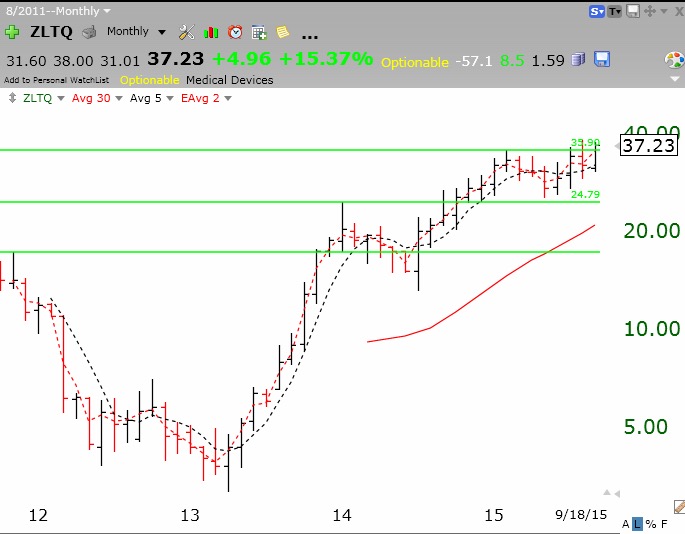
I have written about the fact that stocks that remain strong in a weak market are worth monitoring. I wrote that ZLTQ has a new (cool sculpting) process for eliminating body fat. I heard about it from a friend who has undergone the procedure. ZLTQ is holding its recent GLB, green line break-out, even in this market. I am watching ZLTQ closely. Here is its monthly chart.
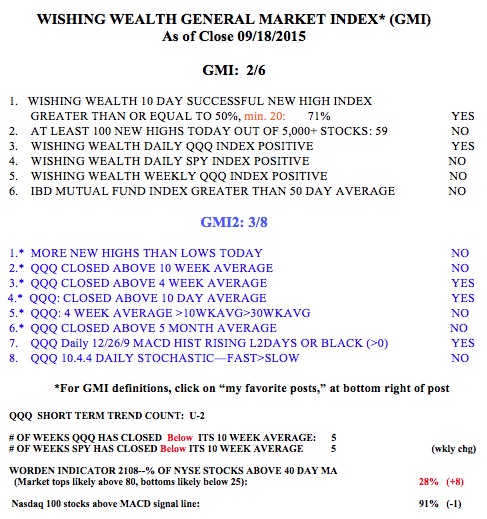
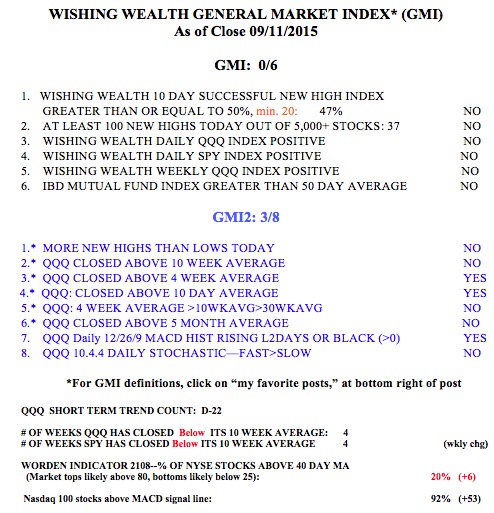
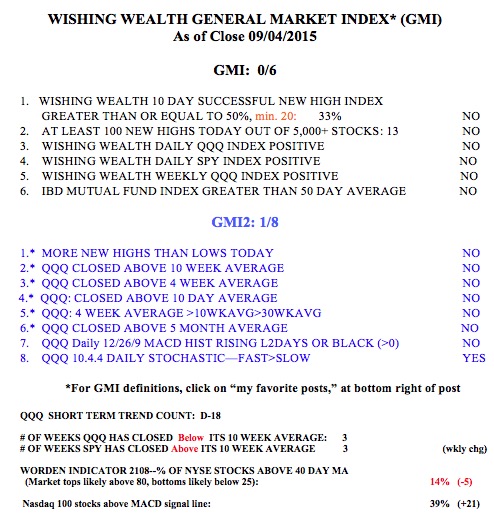
The GMI remains on a Sell signal.