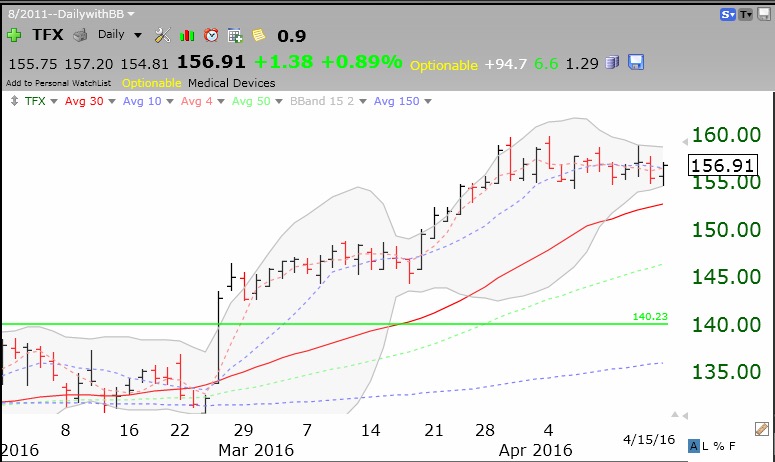
TFX is a strongly advancing stock that just bounced off of its lower 15.2 daily BB. If I bought it I would place a sell stop below Friday’s low price. This is a strategy I teach my undergraduates.
 The GMI remains on a Buy signal.
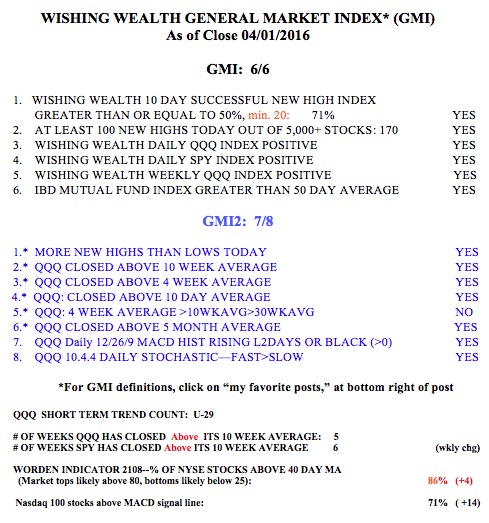
Stock Market Technical Indicators & Analysis
TFX is a strongly advancing stock that just bounced off of its lower 15.2 daily BB. If I bought it I would place a sell stop below Friday’s low price. This is a strategy I teach my undergraduates.
The GMI remains on a Buy signal.
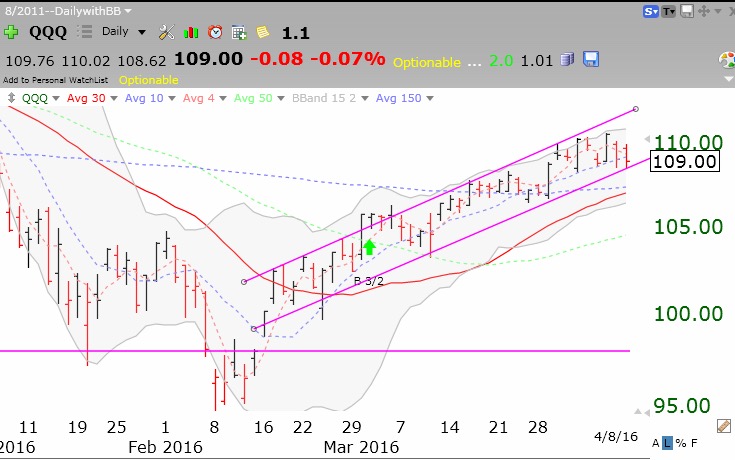
Will the market rise with earnings coming? While reporting companies can blame their past weak results on the strong dollar, maybe they will forecast better results this quarter, with the dollar weakening. The QQQ is in a tight channel. If this channel fails to hold, I expect support at the lower 15.2 Bollinger Band, around 106.44. If this level were to fail, I would expect more weakness. But the rising 30 day average (red line) is an important sign of strength.
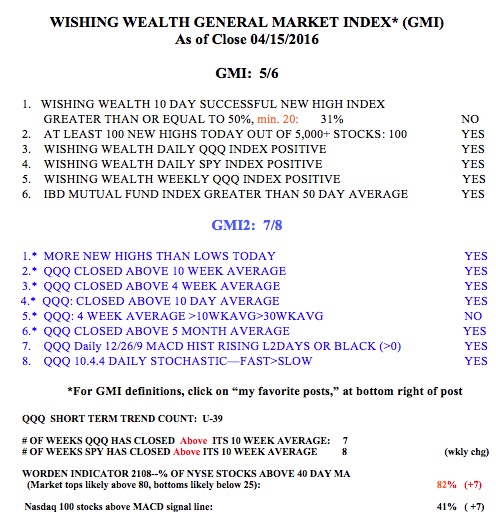
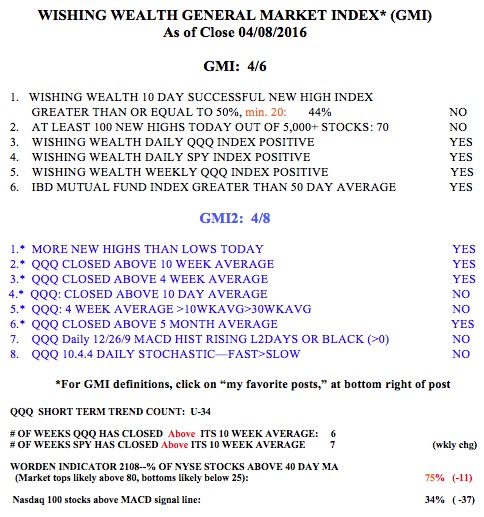
 The GMI is at 4 (of 6) and still on a Buy signal.
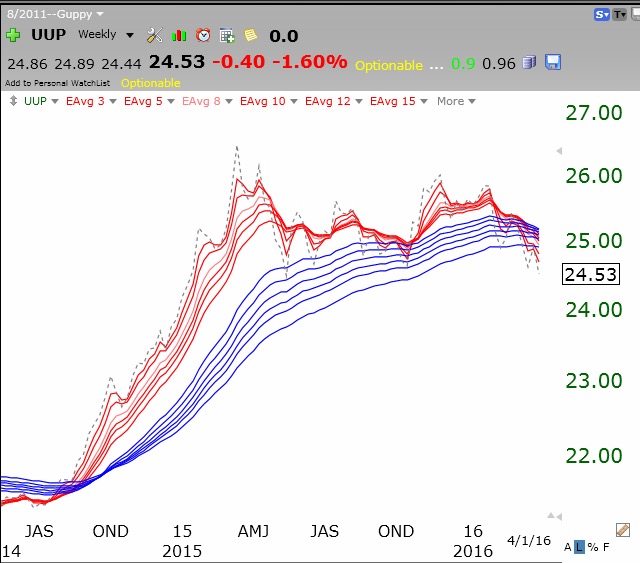
This GMMA chart of the dollar index (UUP) suggests to me that the dollar’s up-trend is over. A weakening dollar implies lower interest rates and more profits for large US international companies that must translate their foreign currency earnings back into dollars. This may be why the market is strengthening— in anticipation of brighter second quarter forecasts to come with the imminent first quarter earnings reports.
 Below are five GLB (green line break-out) stocks that came up in my TC2000 alerts the past 30 days.
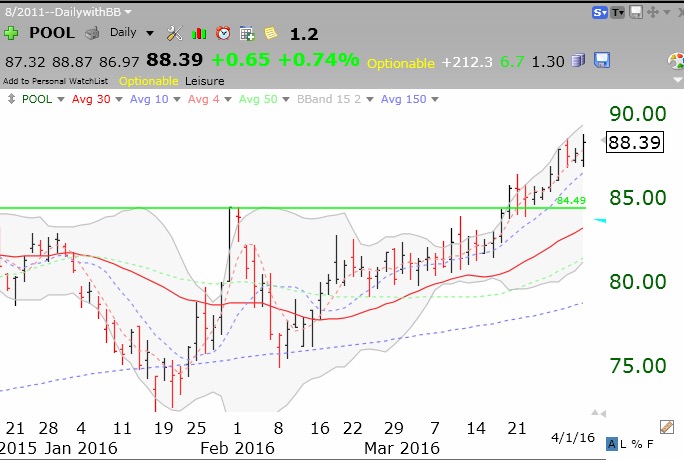
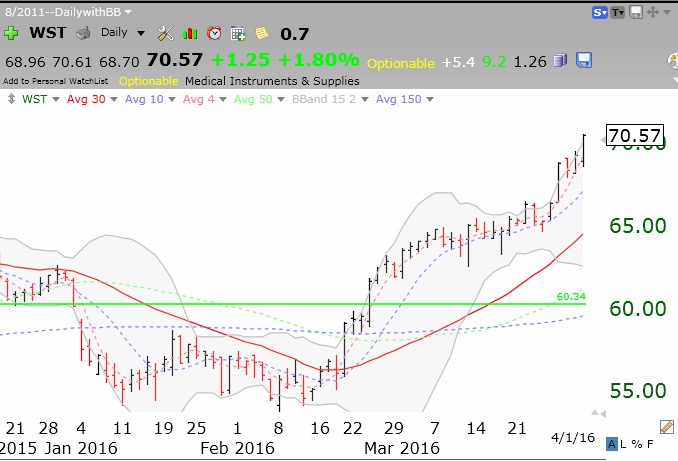
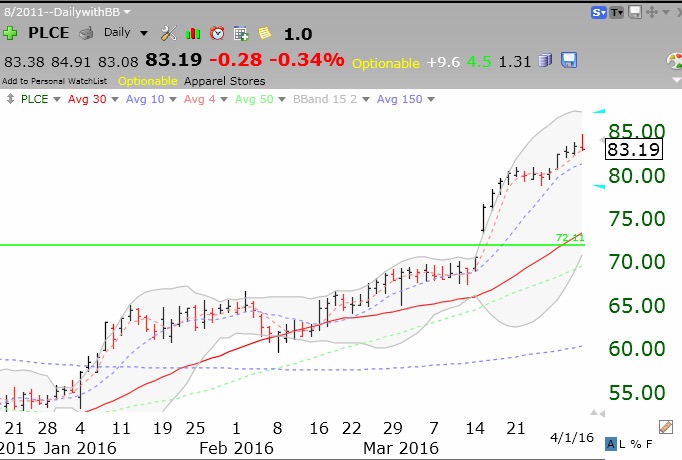
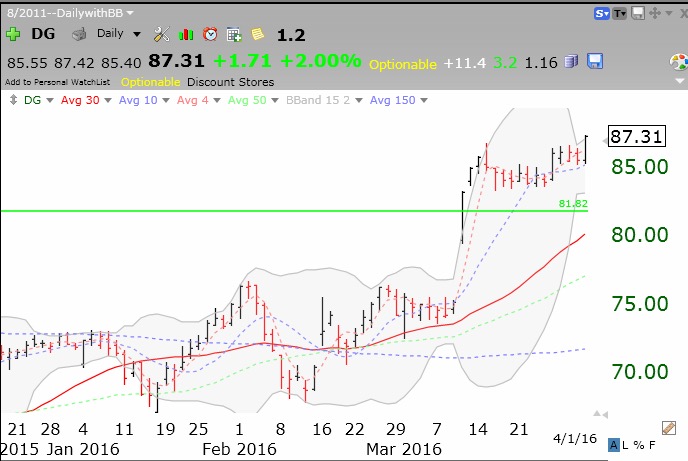
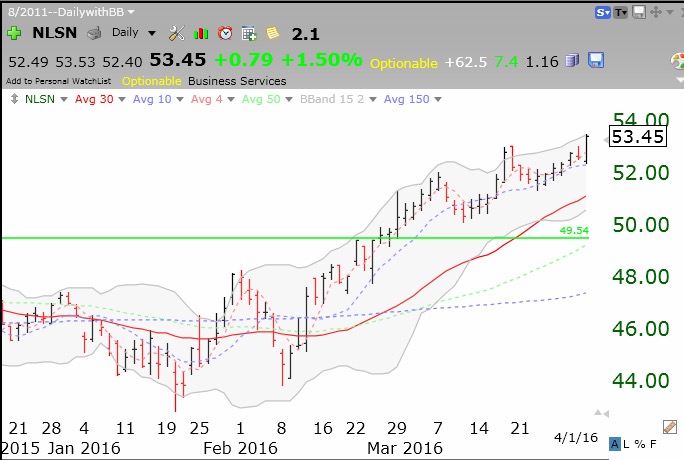
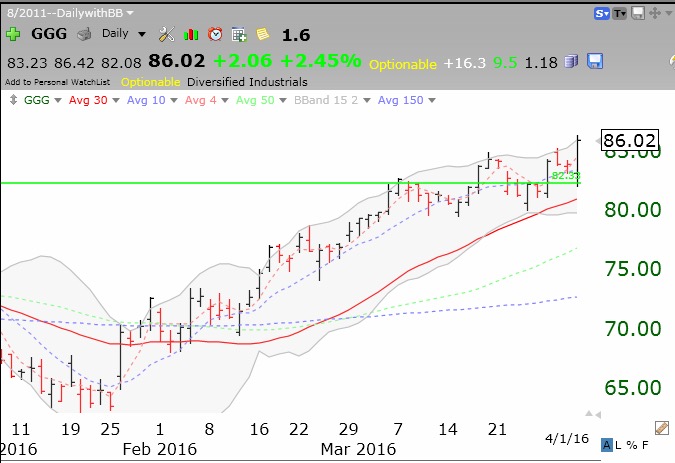
Not all GLB stocks work out but I must admit, most of the recent alerts have worked out. In a rising market, buying GLB stocks breaking to all-time highs can be a profitable strategy. GGG just broke out on Friday. Will it also prove to be a winner?
 And the GMI table: