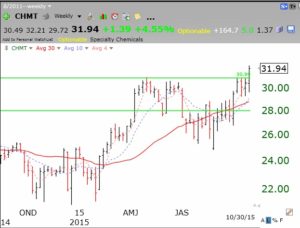
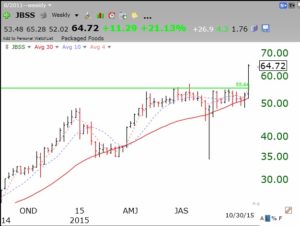
Here I am in cash and not participating in this rebound. Then again, I did not have to worry about the summer decline as I was safely on the sidelines. So what to do now?
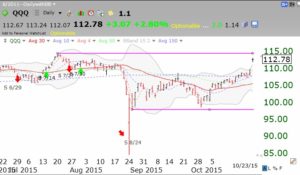
True, according to the Sell in May mantra, one should get back into the market at Halloween, as Mark Hulbert eloquently reminds us. I am not ready to return just yet, however. (Maybe I will turn out to be a great contrary indicator!?) A few things continue to trouble me. First, the media seems to be ignoring the possibility of a debt limit debacle and default on government debt. Second, we could have a government shutdown. This market could turn down quickly if either of these events materialize. On the technical side there are some troubling technical signals. This daily chart of the QQQ shows that the QQQ is approaching major resistance. The QQQ closed outside of its upper 15.2 daily Bollinger Band on Friday and a major index rarely does so without a reversion to the mean (here the 15 day average). The daily 10.4 stochastic is overbought at 87 and the fast 10.4 stochastic is below its slower 10.4.4 stochastic. Finally, the last time the QQQ had a large weekly gain (5.9%) like last week’s (4.3%) was the week before the July top. The QQQ might therefore be setting itself up for a quick decline, at least to the lower BB (at 103.47, an 8% decline).
 And AAPL reports earnings this Tuesday. IF AAPL disappoints or rises and fails to hold the gain, it could be the trigger for a decline in the QQQ. Most of the good earnings news for the other stocks heavily weighted in the QQQ is already out.
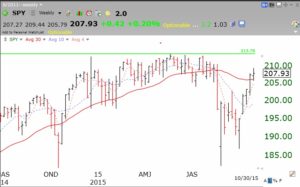
And while the strength of the QQQ reflects the strength in tech stocks, the major nontech industrial stocks are much weaker, reflected in this weekly chart of the SPY. Which group will lead the market up or down over the rest of the year?
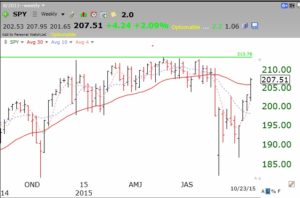 I am concerned by the fact that the 10 week averages for the QQQ, SPY and DIA remain below their 30 week averages. I will slowly return to the market on the long side when the 10 week averages climb back above the 30 week averages. Who knows when that will happen…..
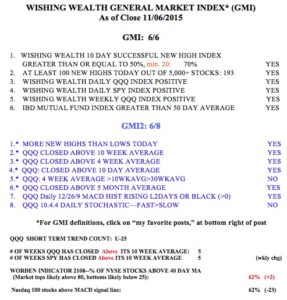
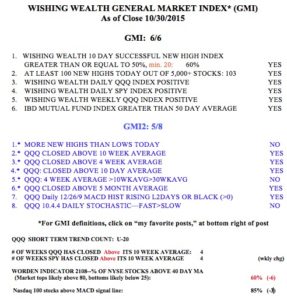
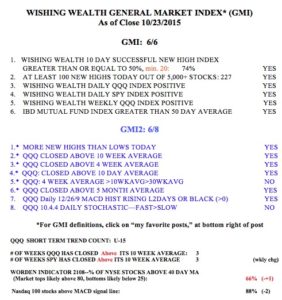
Meanwhile, the GMI remains a positive 6 (of 6). If I was eager to trade I would have just followed the GMI’s signals. But after the August flash crash, I am much more of a chicken right now than usual…..
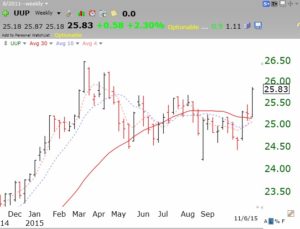
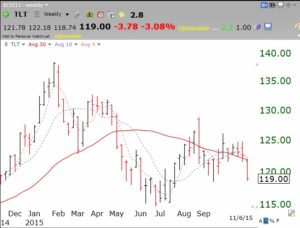 And the rising rates will cause the dollar to rise in value, thus hurting multi-nationals when they convert their overseas earnings back to dollars. U.S. goods will also cost more in foreign countries. Check out this weekly chart of UUP, which is an ETF of the dollar…