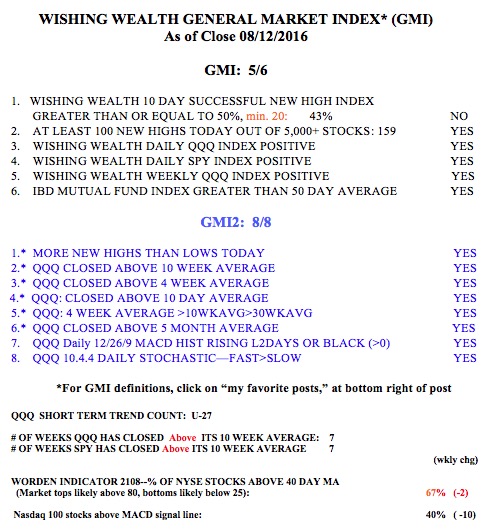
The GMI2 is only 6 of 8 because the QQQ daily stochastic and MACD indicators are weakening. Traditional September slump on horizon?

Stock Market Technical Indicators & Analysis
The GMI2 is only 6 of 8 because the QQQ daily stochastic and MACD indicators are weakening. Traditional September slump on horizon?
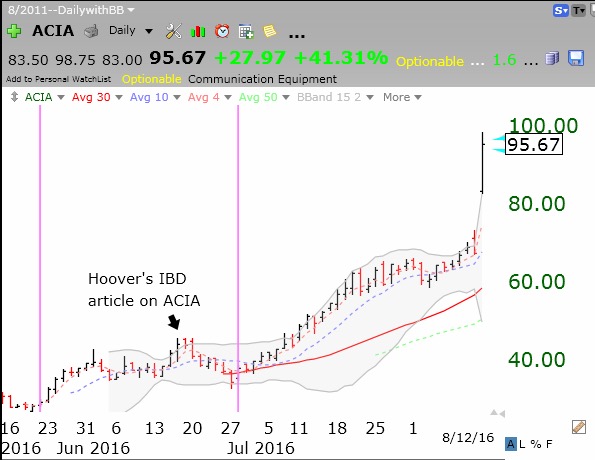
Everyone now knows that ACIA, now at $95, was a great IPO to buy at $40. Who would have known back then? Try Ken Hoover at IBD, who wrote about ACIA last June. This is why I have been reading IBD since the 80’s.
Meanwhile the GMI remains at 5 (of 6).
It just is not worth it for me to try to find in advance the rare stock that will beat the 3X leveraged NASDAQ 100 ETF, TQQQ.
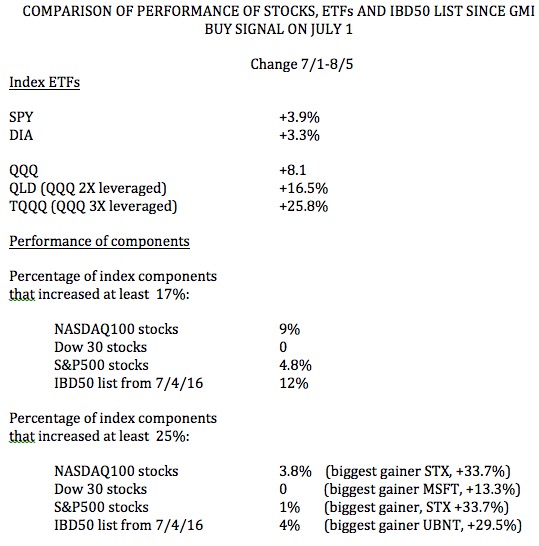
Fewer then 5% of the stocks in the DOW, SPY, QQQ and IBD50 list from 7/4 beat the performance of just holding the TQQQ since the GMI Buy Signal on July 1 (+25.8%). Even the more conservative QLD (2X leveraged) does better. How many times must I repeat this analysis before I change my approach. The best strategy is for me to wade into TQQQ after a GMI Buy Signal. Trying to find the rare stock that will beat the TQQQ is a fool’s errand, just to satisfy one’s ego. The goal is to have the best chance of making money, not to hit the very rare lottery.
The GMI remains on a Buy Signal at 5 (of 6).
