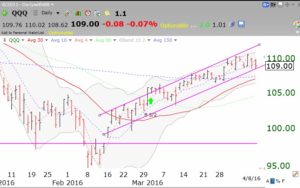
Will the market rise with earnings coming? While reporting companies can blame their past weak results on the strong dollar, maybe they will forecast better results this quarter, with the dollar weakening. The QQQ is in a tight channel. If this channel fails to hold, I expect support at the lower 15.2 Bollinger Band, around 106.44. If this level were to fail, I would expect more weakness. But the rising 30 day average (red line) is an important sign of strength.
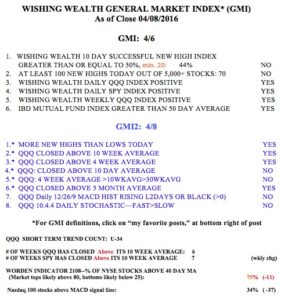
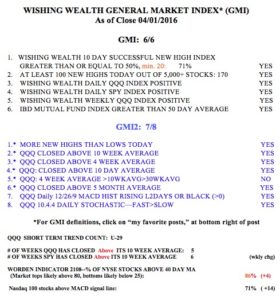
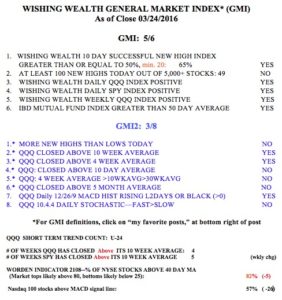
General Market Index (GMI) table
29th day of $QQQ short term up-trend; weaker dollar = larger profits; 5 successful GLB stocks
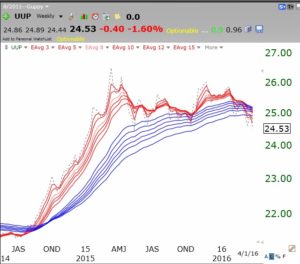
This GMMA chart of the dollar index (UUP) suggests to me that the dollar’s up-trend is over. A weakening dollar implies lower interest rates and more profits for large US international companies that must translate their foreign currency earnings back into dollars. This may be why the market is strengthening— in anticipation of brighter second quarter forecasts to come with the imminent first quarter earnings reports.
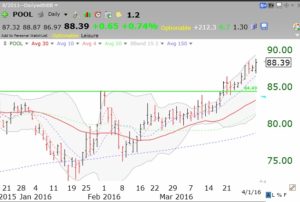
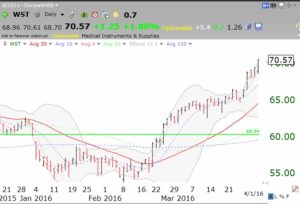
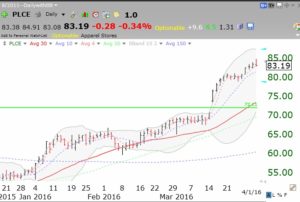
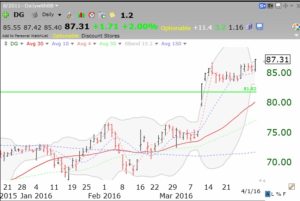
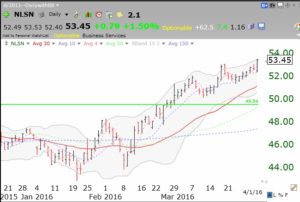
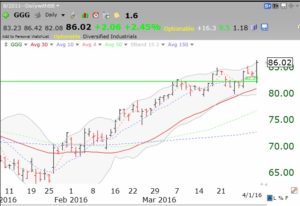
 Below are five GLB (green line break-out) stocks that came up in my TC2000 alerts the past 30 days.
Not all GLB stocks work out but I must admit, most of the recent alerts have worked out. In a rising market, buying GLB stocks breaking to all-time highs can be a profitable strategy. GGG just broke out on Friday. Will it also prove to be a winner?
Critcal week for market coming up; GLB: $TFX, $ESLT
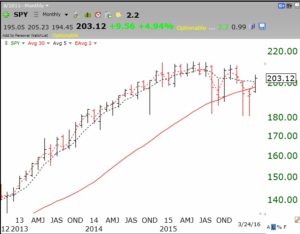
This week there will be more comments from the FED and we will be in the middle of the period when mutual funds dress up their end of quarter portfolio reports for their shareholders. I am therefore expecting strength in the recent winners ( the 4 FANG stocks, FB,AMZN,NFLX and GOOG, are looking better) for this last week of the first quarter. Then we may get a decline until earnings come out later in mid-April. I do not think this market is in bad shape. Look at this monthly chart of the SPY. Compared to what happened in 2000 and 2007, this market looks pretty healthy.
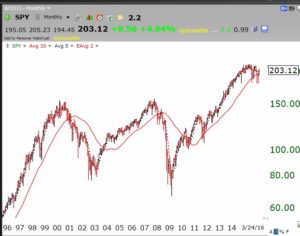 This blow-up of this monthly chart since 2013 shows more clearly what has been happening recently.
While the market has leveled off and we have had a few down months, the market has been resilient. This index would have to break below these recent lows for me to become concerned. So we could see a rising market for the rest of the year. However, we need to remember that the market typically performs poorly during the first term of a new president, and this next president could be something! All new presidents tend to tighten the budget early in their term so that they can relax things and spend more to ignite the economy just in time for their re-election campaign…
There were again few new 52 week highs on Thursday, only 49. There were even more new lows than highs. This suggests that buying stocks at new highs and GLBs has not worked out most of the time. One that has, that I have been following is TFX, which had a huge volume GLB around $140 on 2/25 and has not looked back. Note the unusually high volume when the stock broke above its green line top to an all-time high.
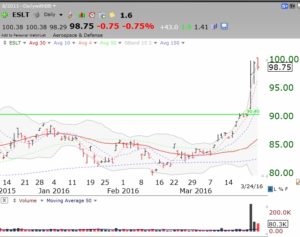
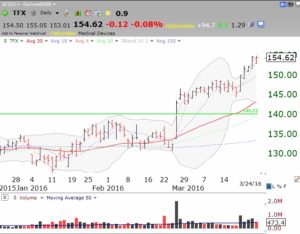 This is exactly the type of price action we want to see when we buy a GLB. But few GLBs have turned out this well recently. It is very important to sell a GLB stock quickly if it does not behave like TFX. ESLT also broke out last week. TC2000 sent me and my students a GLB alert at the open on 3/22, at 91.46. ESLT closed that day at 97.50. Note the large volume on the break-out.
Meanwhile the GMI is at 5 (of 6) and still on a Buy signal. The GMI2 is only at 3 (of 8) reflecting its very sensitive short term components.
