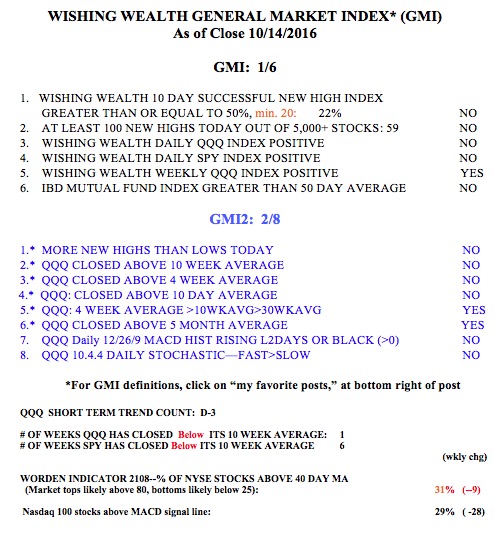
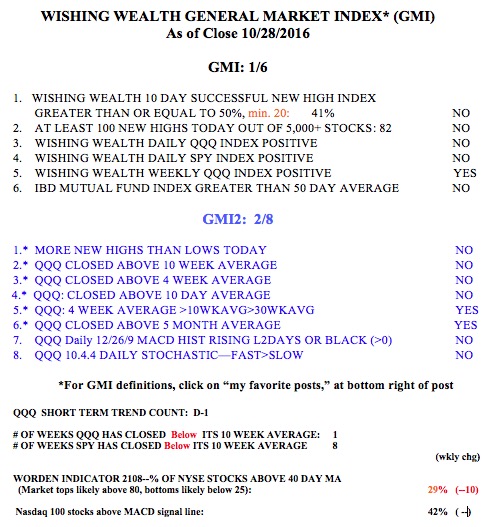
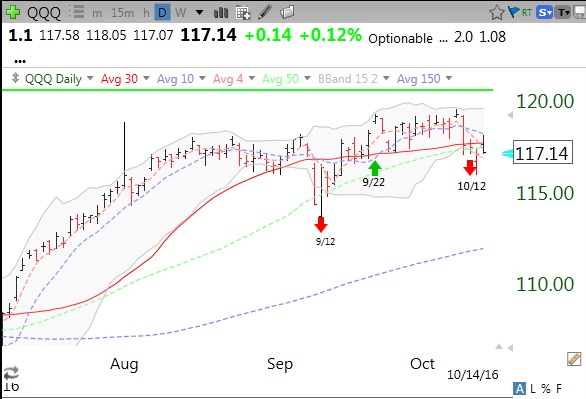
I am mainly in cash in my trading accounts but holding a small position in SQQQ. If the short term down-trend continues a few more days I will add more SQQQ (the inverse 3x leveraged bearish QQQ ETF). The T2108 is at 31% and would have to fall closer to 10% to suggest a very over-sold market where significant declines end. The 10.4 daily stochastic is at 25, low, but still not in extremely oversold territory. And the QQQ has just had an oversold bounce from its lower 15.2 Bollinger Band but it looks like this support level could fail to hold. The daily 12/26/9 MACD histograms are negative and declining, showing downward momentum. The GMI signal recently flashed Red, but this signal has recently coincided with short term bottoms rather than tops. Time for me to be extra careful and to conserve cash while Mr. Market makes up his mind which direction to go.
However, Mark Hulbert’s recent post reminds me that this may be the time to return to the market according to the “Sell in May” strategy. Mark has a perspicacious empirical approach to analyzing the market’s behavior. Coming up is the seasonally strongest time for the market, he writes, and the current weakness may be setting us up for it. Scare everyone into selling out to stronger hands who will buy low and profit from the subsequent move up. Most advances begin after a decline. So I will reverse and go long if this market shows any signs of strength in the coming days………
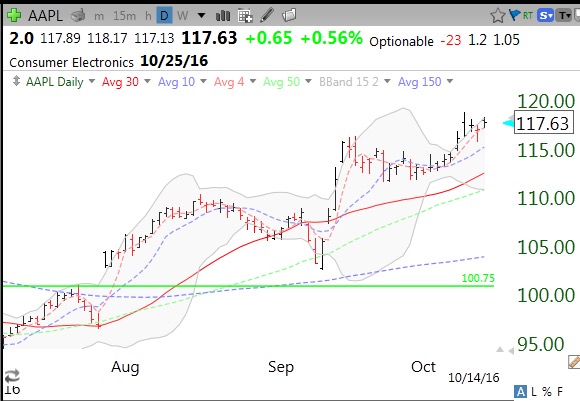
One of the major reasons the QQQ is outperforming SPY and DIA is the technical strength shown by AAPL, which is heavily weighted in the computation of QQQ’s underlying index (NASDAQ 100). AAPL is defying gravity and may be the last component to decline before the current weakness in the QQQ ends? (When the bulls give up on AAPL, the end of the decline may be near.)
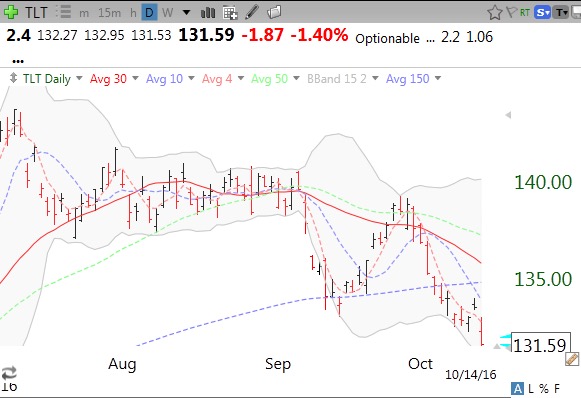
A major factor behind the weakening of the indexes is falling long term government bonds, representing higher interest rates and leading to lower gold prices. I follow the 20+ year government bond ETF, TLT, as an indicator of how bond traders feel about long term interest rates. TLT is in a swoon, leading to a higher dollar and lower gold prices.
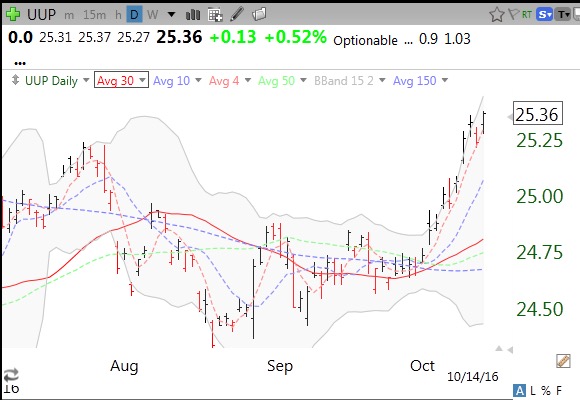
And the dollar rises, as shown by UUP.
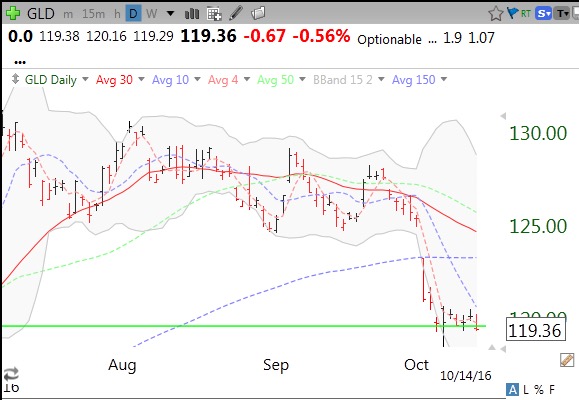
And gold falls, as shown by GLD. It all fits together like a jig saw puzzle–until it doesn’t…
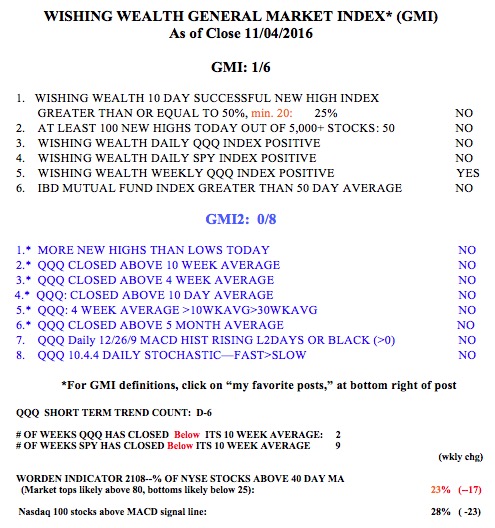
The GMI table below shows that the QQQ has just closed the week below its critical 10 week average while the SPY has done so for 6 straight weeks. Will there be a Halloween rally?