There are a number of factors suggesting that the current QQQ short term up-trend is about to end:
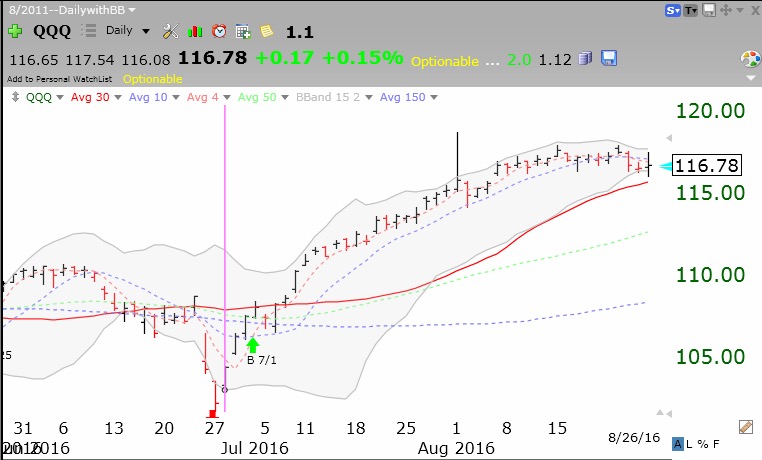
- Daily Bollinger Bands are very narrow, indicating low volatility and an imminent break in one direction or the other;
- Daily MACD histograms are negative;
- Daily fast stochastic is below slow stochastic;
- After many weeks, QQQ has closed below 10 day and 4 week averages;
- 2nd quarter earnings are mostly out–post-earnings lull;
- On verge of weakest month of year–dreaded September;
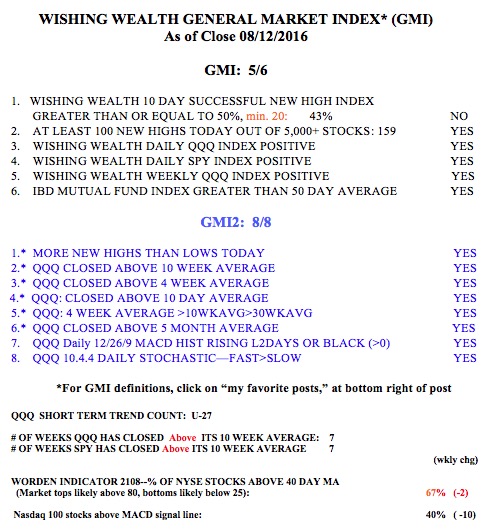
- GMI2=4 and T2108 weakening;
- Growing anxiety over a possible Fed hike in September, and November election;
- Sell in May, come back on Halloween;
- Completed 37 days of QQQ short term up-trend.
Time for me to raise sell stops and be defensive— until Mr. Market tips his hand…..