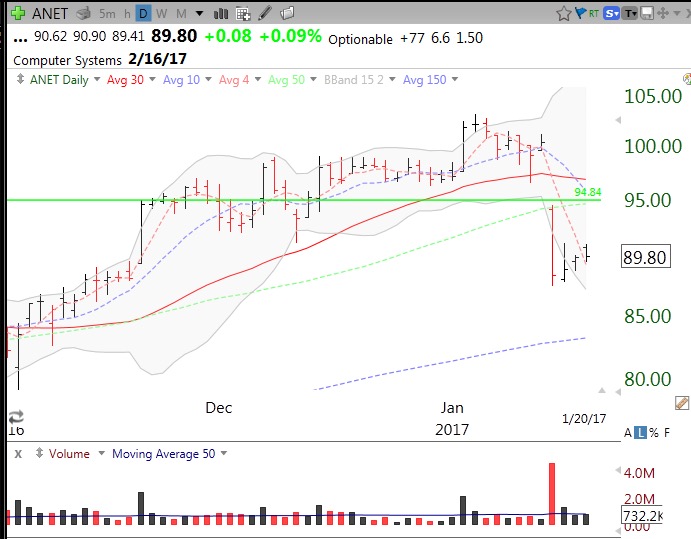
I have noticed over the years that when many of the rocket stocks I follow all move up together the market is often near the end of a move. This happened last week. Also, after earnings season is over, many stocks rest or go into a decline until the next quarter’s earnings come out. Furthermore, the FANG stocks(FB,AMZN,NFLX,GOOGL) have performed poorly after earnings came out, even after a beat. So I am taking action to make sure I do not lose much of my recent profits. I am also not holding anything through earnings and I am raising my sell stops on all of my positions…
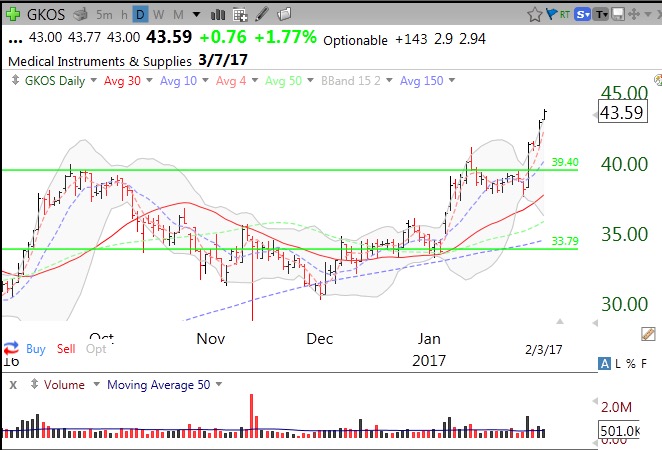
GKOS, one of the GLB stocks I have tweeted about has been strong. After a false start, a GLB occurred with high volume and the stock has not looked back, but it has now gone vertical. Note that the first GLB in January failed and was followed by a successful one.This is a common occurrence. I often buy back stocks I have been shaken out of which then go on to produce a profitable trade. GKOS is also a possible cup with handle break-out.
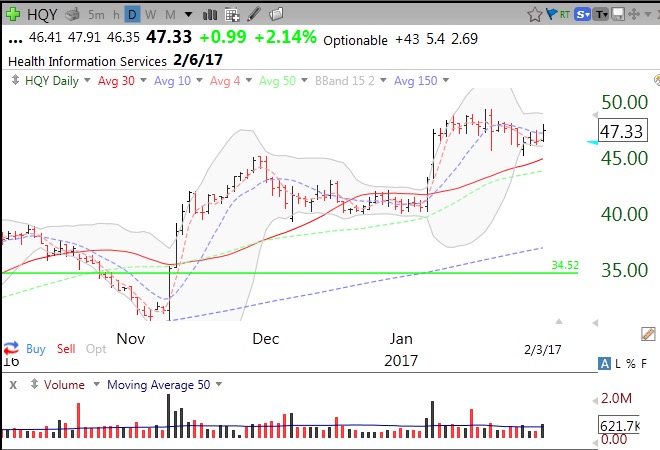
One of the scans (01292017ATHhipast40daysBLBB, see this blog’s glossary for a definition) I released in my TC2000 Club (wishingwealthblog.com/club) identified a recent GLB stock, HQY, in my ATH watchlist that has just bounced off its 15.2 daily lower Bollinger Band. I am watching to see if this stock gains momentum this week. But earnings are due on 2/6. Note the successful GLB in November, followed by a consolidation in December, a rise in January and another consolidation. This is how a growth stock should behave, building base upon base. My strategy is to buy on a bounce off of support or at a break-out from a base on high volume. HQY came public in 2014 and has more than doubled over the past year.
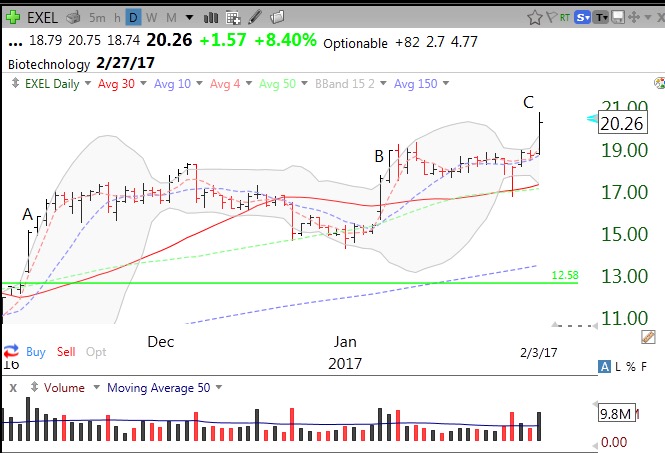
As many of you know, my stock buddy, Judy, has a great ability to pick winners. She has been talking to me about EXEL for some time and I have started monitoring it. While it is not near its ATH ($50.50, the green line below is from an earlier peak) it is showing promising technical strength. Note the series of base break-outs at A,B,C. Judy is a “concept” focused technical analyst and likes to find stocks that she thinks have great products or are in industries of the future. Someone else apparently agrees with her and is apparently accumulating EXEL…..
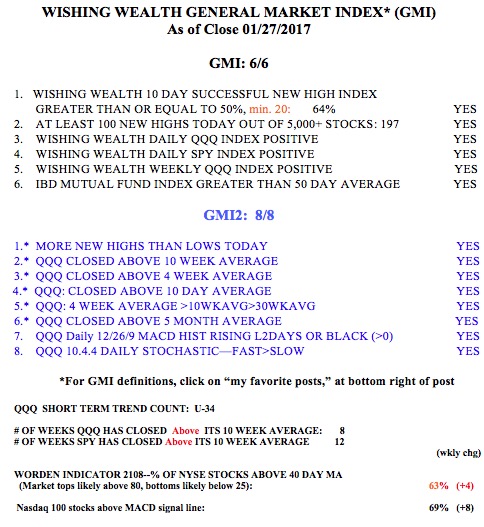
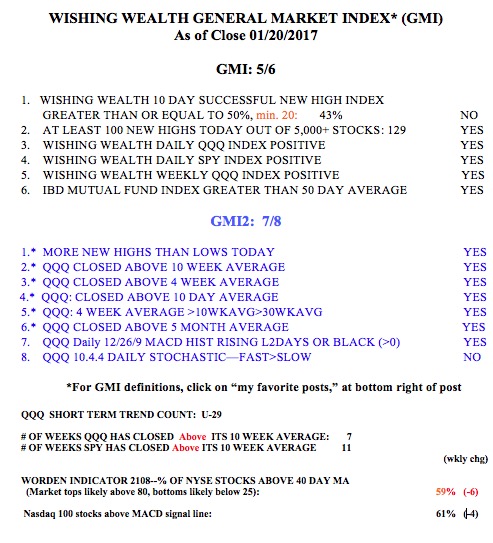
All of the GMI and GMI-2 components are positive. Friday was the 39th day (U-39) of the current QQQ short term up-trend. Since the first day of that up-trend on 12/8, QQQ is up +6% and the TQQQ is +19.3%. In that time, GKOS is up +29.9%. HQY +14.7% and EXEL +19.8%.