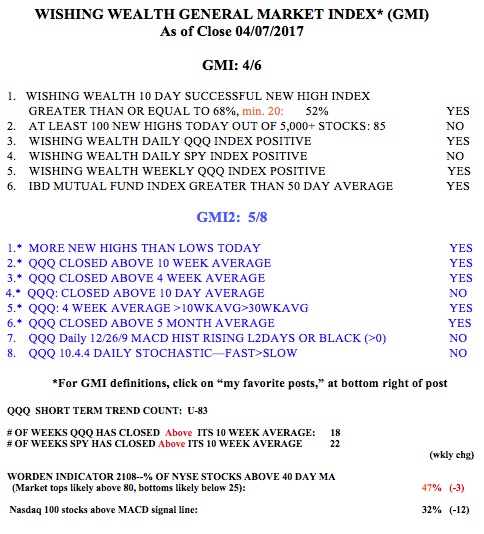
The GMI turned Green on November 10. Since then the QQQ has advanced + 12.7% through last Thursday. Another GMI reading below 3 on Monday will turn it to Red. The SPY/DIA/QQQ all closed below their 10 week averages, an ominous sign of weakness. My separate but somewhat correlated and more sensitive QQQ short term trend indicator has already just turned down (D-1). About 40% of the new QQQ short term down-trends since 2006 lasted under 5 days. I therefore do not trade much on the short side with a 3X inverse ETF like SQQQ until the new down-trend exceeds 5 days. The longer term trends remain up and I must respect that. Most of the indexes are no longer in daily RWB up-trends but their weekly RWB patterns remain intact. Below are the daily and weekly RWB charts for SPY.
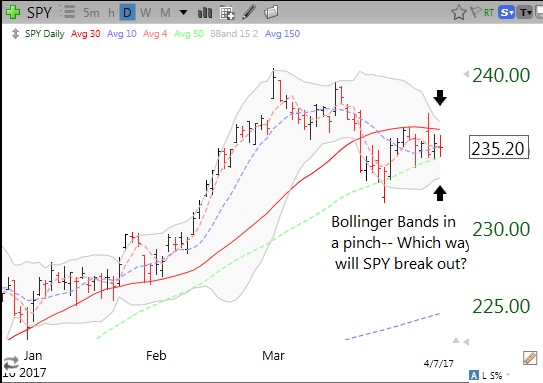
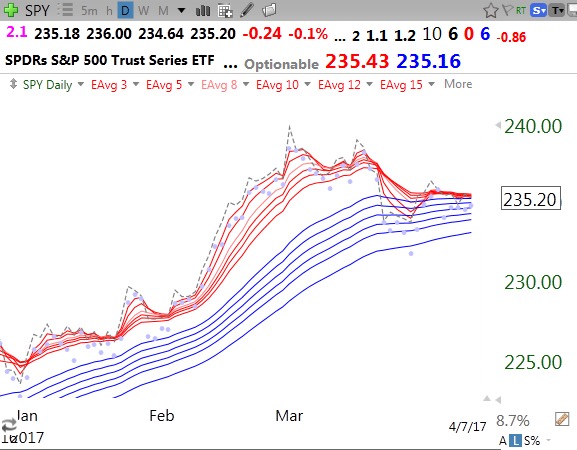
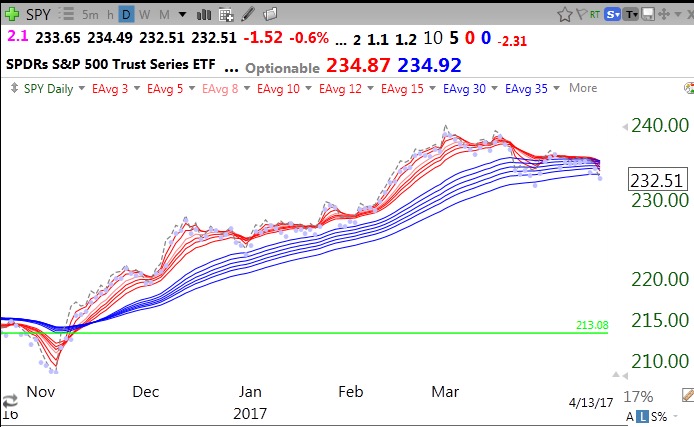
Daily SPY: Note the 0/0 pattern, reflecting that the SPY has now closed (blue dotted line) below all 12 daily moving averages. A return to 6/6, signifying a close above all 12 averages, would be a new buy signal for me.
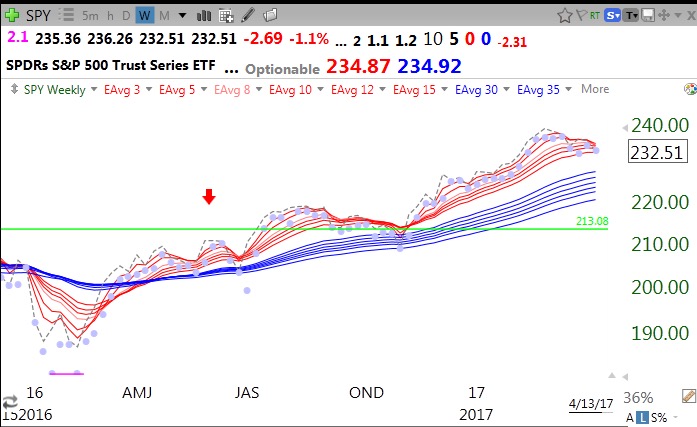
And the weekly RWB: The 10 shows that 10 (10/5/0/0) of the 12 weekly averages line up properly with each above the next longer average.
My interpretation of these patterns is that the SPY is in a short term pause within a longer term up-trend. Should the weekly chart turn BWR I would consider transferring my university pension from equity mutual funds into money market funds, something I do very rarely. The DIA and QQQ show similar patterns– a vanishing RWB daily pattern and a continuing RWB weekly pattern. It is so much more safe and profitable to trade on the long side when the daily and weekly charts both form RWB patterns…
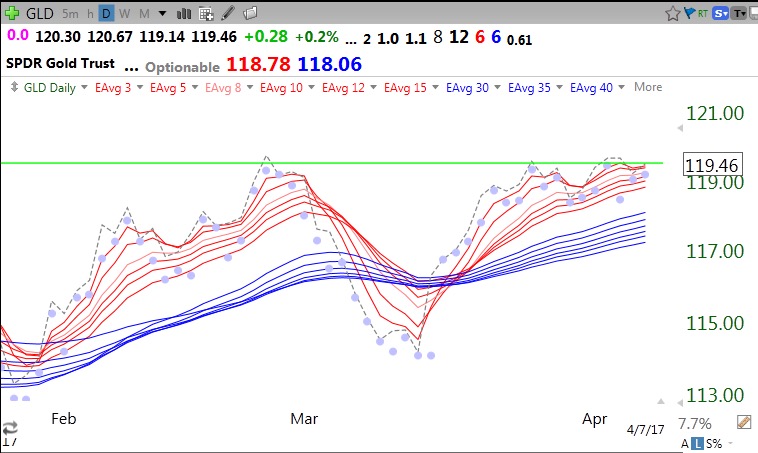
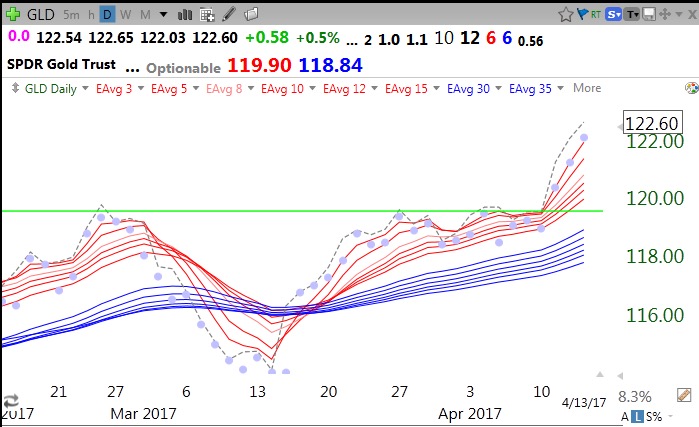
On the other hand, GLD (gold) remains in a strong daily RWB pattern, 12/6/6. (The green line is from a prior top/base.)
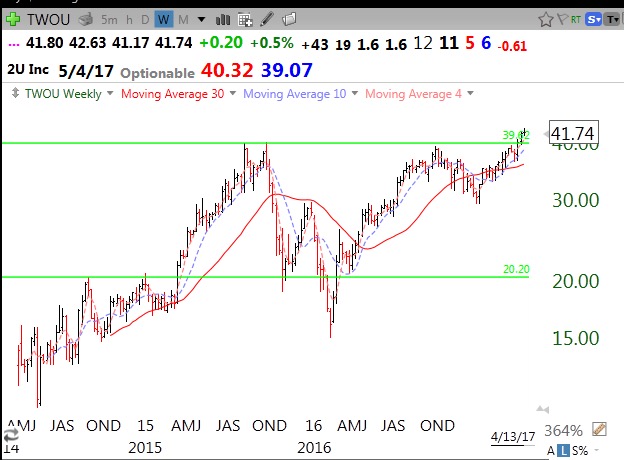
I like market declines because it is easier for me to find potential leaders in a dwindling new high list. There were only 60 new 52 week highs on Thursday in my US stock universe of 4800 companies. I looked through them to see if there were any green line break-outs (GLB) going to all time highs. That is how I found TWOU. I found that TWOU is signing up the most prestigious universities in 10 year contracts to offer their graduate degrees using their innovative online digital platform. While this may not be the time to buy anything, I think it is worth putting TWOU on my watchlist. This weekly chart shows that TWOU came public at $13 in 2014 and has now tripled in price. Some Fidelity funds are reported to have positions. They must see something good here…..
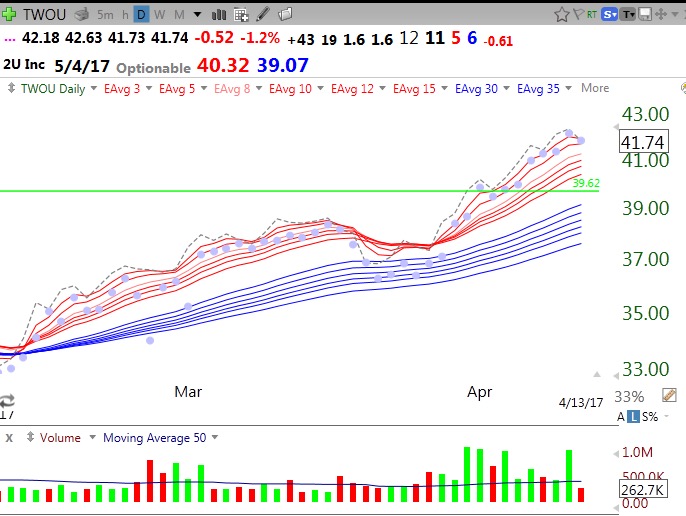
Note the daily RWB pattern (11/5/6) and the above average green volume spikes on up days. Some institutions are buying….
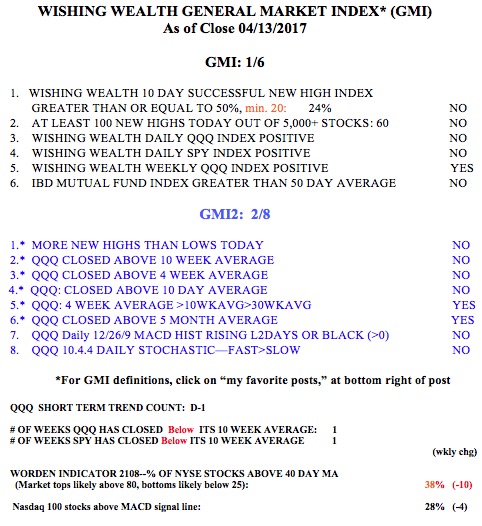
The GMI is now at 1 (of 6) and still on a GREEN signal. One more day below 3 will change it to RED.