All World Stock Markets entering BWR Down-trends! I am in cash and monitoring T2108

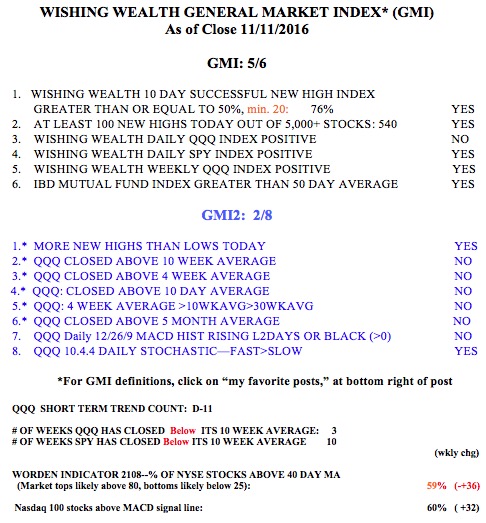
GMI0/6
GMI-20/9
T210815%

I assume that most  U.S. part-time traders, like me, tend to monitor  closely the U.S. stock indexes. I have been writing that the major indexes I follow (DIA, QQQ, SPY and NYSE) appear to be entering major down-trends, showing the RWB pattern I invented by modifying GMMA weekly charts. My charts have 12 exponential weekly moving averages, a band of 6 shorter averages plotted in red, and a band of six longer term averages in blue. A strong up-trend is evident when all of the red lines are well above the rising blue lines such that there is a white band separating them. I call this an RWB pattern, Red/White/Blue. A significant down-trend is evident when the reverse is true, giving a BWR pattern. I also include in my charts a gray dotted line that shows the weekly close of the index being plotted. This more recent price line (gray dotted line) tends to lead the averages.

The past few weeks I have been showing you that the U.S. indexes I follow have been transitioning from a multi-year strong RWB up-trend into a BWR down-trend. This is clearly evident in this weekly chart of the SPY. The NYSE index, composed of large multi-national stocks, is in a fully formed BWR down-trend.

01082016SPYgmma

NYSE

All of the other U.S. indexes I follow have  patterns  similar to the SPY, although the QQQ, shown below, composed of nonfinancial tech stocks,  is  less far along than the others in forming a BWR pattern. It is clear from these charts that these markets have come out of a  multi-year RWB up-trend. In an RWB the gray dotted line is largely above the red averages, showing that the direction is headed up. In a BWR down-trend the reverse is true. Note that the gray dotted lines in the above two charts are now below all 12 averages, signalling a deepening down-trend. One  sign of a new up-trend would be if the gray dotted line were to close back above all 12 averages, although I prefer to see the full RWB pattern develop before I trade big with a changed trend. My primary conclusion is that the RWB pattern (bull advance) of the lest few years in the U.S. markets  is clearly over and no one  knows when it will come back. Is it too late to sell?  Sorry, no one knows.

01082016QQQgmma

The above discussion would have been my routine analysis of the markets. But given the current market turmoil and the primary cause being ascribed to the market in China, I thought I would look at the chart patterns of markets world-wide. I examined 37 ETFs representing markets across the world. With the exceptions of the markets in Belgium and Ireland, all markets I examined were in well developed BWR down-trends!  Can we legitimately blame all of this on China? I will post just a few representative examples below.

Thailand:

ThailandAustralia:

Australia

Russia:

RussiaSouth Africa:

SouthAfricaUnited Kingdom:

UnitedKingdomGermany:

GermanyHongKong:

HongKongFrance:

FranceChile:

ChileIndia:

IndiaEgypt:

SwedenSweden:

SwedenChina 25:

ChinaI am not an expert on world markets. Maybe one of you can comment on these relationships. Is it really possible that all world markets are going down because of the China market? I suspect not. There is probably another factor driving all of these markets? Deflating commodities?

Did similar relationships occur in 2008? Not all of these ETFs existed in 2008. When I looked back at the patterns across a few countries in 2008 I again saw tremendous similarity across the markets. That does not necessarily mean that we are entering  another crisis like the one  in 2008? Nevertheless, the possible implications of these charts concern me more than a little……..

My GMI remains on a Sell signal with all indicators negative. Where is the bottom? A major past signal of  panic-induced market bottoms that I have noticed is when the Worden T2108 indicator, now 15,  falls into single digits. The monthly chart below shows that T2108 reached 1 at the 2008 bottom,  7 in 2011 and around 6 last August. I post T2108 each day, to the right of this page.

If T2108 goes below 10, I hope to hold my nose and move some cash into an index ETF (SPY or QQQ) or an index mutual fund. I will then only average up if the market continues to recover. I make this promise each time we have a large decline but seldom keep it! At the bottom the market always looks too scary to buy…..

GMI01082016T2108revised


New $QQQ short term up-trend in jeopardy; Market indexes look weak; So do $AAPL,$NKE, $DIS

GMI2/6
GMI-23/9
T210832%

The GMI remains on a Sell signal even as my short term trend indicator for the QQQ is in the second day (U-2) of an up-trend. A down day on Monday could change the short term trend for the QQQ back to down. The QQQ and SPY have now closed below their critical 10 week averages for 4 weeks.

GMI12312015The GMMA charts which I have adapted clearly show the patterns of the major market indexes. When the six shorter term (red) averages are above the rising longer term averages (blue) with a white space between them we have a strong RWB up-trend. When the reverse is true we have a  BWR down-trend.

It is clear that the Dow Transportation average is in a BWR down-trend. Note the strong RWB up-trend lasted for several years, through early 2015. We now have an ominous pattern for those who follow the Dow theory of the market.

GMMADJ20The Dow 30 index is no longer in an RWB up-trend, but a BWR pattern is not in place.

DJ30GMMABut the NYSE index is definitely in a BWR down-trend.

GMMANYSE

Perhaps the NYSE stocks are weighted down more by energy related stocks or multi-nationals. Look at the energy ETF, XLE. It is in a confirmed BWR down-trend. No one but a gambler would try to pick a bottom here. Look how clearly one can see in 2014 the change in trend from an RWB to a BWR pattern. I would never hold a long position in a stock or ETF in a BWR down-trend.

GMMAXLE

The SPY looks like the Dow 30 and has not transitioned into a BWR down-trend yet. But it does show the end of a multi-year BWR up-trend. How much easier (and more profitable) it is  to hold stocks when the indexes are in strong RWB up-trends!

GMMASPY1231The QQQ bearly? remains in an  RWB up-trend.

GMMAQQQWhat does all of the above mean to me?  We have a split market, with  energy related stocks and multi-nationals weak but with tech stocks acting stronger. However, note that the QQQ failed to break through resistance last week, as this daily chart shows. (Click on to enlarge.)

QQQ12312015dailyThe QQQ, at 111.86, is now heading back down towards support, around 109. Will it hold, fail and re-test the lows around 98, or make another run at resistance near 114? The continuing weakness in the leader, AAPL, suggests to me more weakness in techs (and the whole market) lies ahead. This weekly chart shows that AAPL may have completed the head and shoulders top formation I have been posting about for weeks–very ominous, with a price objective around 80.

AAPL12312015

And NKE sold off after a good earnings report.  When leaders cannot rise on good news, it is telling us something about the inner strength (or lack thereof) of the market. Check out this daily chart of NKE.

MKEdaily12312015

Even DIS, with the release of StarWars, could not get out of its own way. Check out this daily chart of DIS.

DIS12312015

Is the bear already upon us? 2016 will tell the story……

11th day of $QQQ short term down-trend; on sidelines

GMI2/6
GMI-26/9
T210837%

This week it will be very difficult to get an idea of the market’s near term trend. There may be some strength from mutual fund end of quarter/year window dressing. But the QQQ short term trend count is D-11 and the GMI remains on a Sell signal. IBD calls the market up-trend under pressure. The market indexes are still bouncing from a recently oversold situation and it remains to be seen how far the bounce will go. The QQQ,  at 112.59, faces considerable resistance around 114.  There does not appear to be much more room to climb, unless the index should burst through the formidable resistance. Under these circumstances I find it best to stay mainly on the sidelines and to wait for a sign of a resolution of the battle between bears and bulls. It may take until early January to get some clarity. What a nice time to relax and enjoy my academic between semester vacation.

GMI12242015