One of my favorite stock gurus, David Ryan, William O’Neil’s protege, when asked about the types of set-ups he looks for, said:
“I basically simplify it down to two, breakouts and pullbacks. Don’t get confused by all the different formations. You don’t really have to look for cup with handles, or saucers, or “W” formations. You just have to draw a line across the top of where most of the stock’s trading has taken place. Then you buy as it moves through that line. It is as simple as that. I always like to see a very tight price pattern before the stock breaks to new highs. Buying pullbacks are a bit more complicated but offer another entry point to get aboard a leading stock.”
Momentum Masters, Mark Minervini, David Ryan, Dan Zanger and Marl Ritchie II, 2015, p. 72.
[asa]0996307923[/asa]Momentum Masters compares answers to a series of questions asked of four of the best stock traders ever. I highly recommend it. By the way, David Ryan is doing a webcast for IBD on his current take of the market this week. Click the link or go to investors.com for information to register.
Ryan’s quote above really fits in well with my trading strategy. I draw a green line at a stock’s all time high that has not been surpassed for at least 3 months. I then look for a break above that line (Green Line Break-out, GLB). I set an alert in TC2000 to tell me when the GLB occurs and when it does I then inspect the stock for signs of unusual break-out volume and good fundamentals. Alternatively, and more often, I look for a stock near or just above a recent GLB that has pulled back and become over-sold and started to rise. If I buy it, I place my sell stop close, just below the recent bounce/support. I never know if a bounce will work out, but if it fails, I exit with a small loss. That is the key to this game–a few large gains and many small losses. Many successful traders say they are right on fewer than 50% of their trades.
This weekend I created a new TC2000 scan that you can run yourself when you get TC2000 (See $25 coupon offer at top of this page). All of the students in my new honors class will learn how to use TC2000. Once on TC2000, join my Club and select this scan: 01292017ATHhipast40daysBLBB. All of my publicly available free scans are described in the Glossary tab for this blog. This new scan looks at all stocks in my ongoing WatchList of about 800 stocks that have recently hit an all-time high (ATH). It finds the subset of them that hit a new high in the past 40 days and that is now bouncing from up from its lower Bollinger Band. In simple words, the scan finds rocket stocks trading near their ATH that have recently hit their peak and that have since pulled back and started up. I next look to see if the stock is above its last GLB. Many stocks rise after their GLB and then pull back and resume their advance. PLAY is one of the 15 stocks that came up in this scan, which I give as an example.
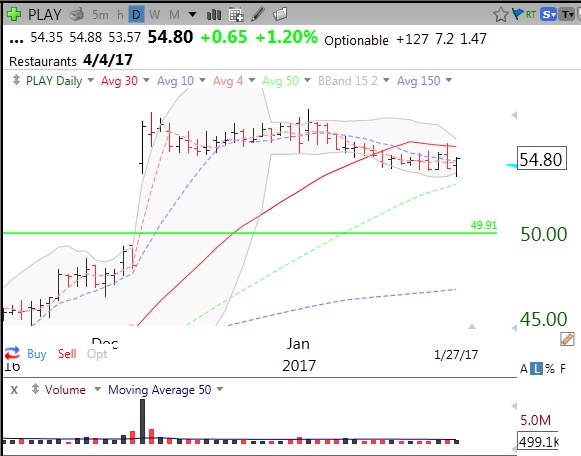
PLAY gapped up on unusually high volume in December and then traded sideways since. Last Friday it bounced off of its lower 15.2 daily BB and closed near its high of the day. Is this the beginning of a resumption of its rise? No one knows, but it might be. If on Monday PLAY trades higher than Friday’s high of 54.88, I might get interested enough to buy some. Unlike a break-out, a bounce does not require higher volume. The low trading volume is a sign that the selling has dried up. Note from the line at the top of this chart that PLAY is due to report earnings on 4/4 and last quarter’s earnings were up +127% according to stats in TC2000. It has a recent short ratio of 7.2 and is up 47% over the past year. It is also on the current IBD50 list with a COMP rating of 93 and EPS rating of 99–not too shabby….
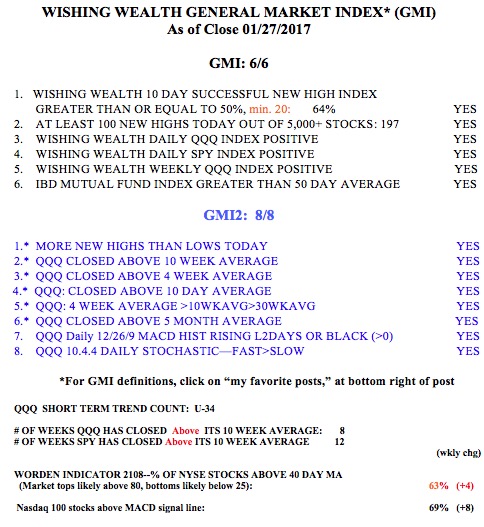
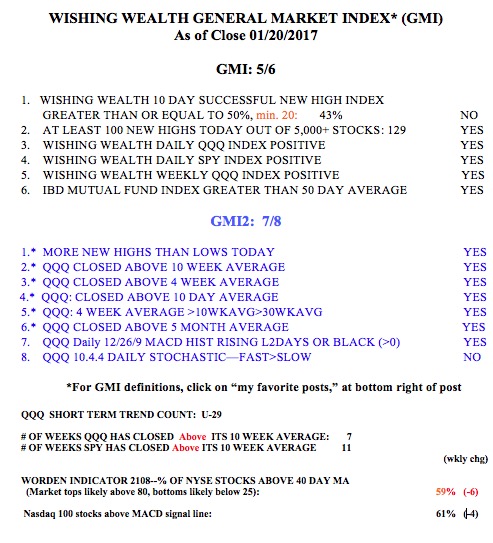
Meanwhile the GMI remains at 6 (of 6).