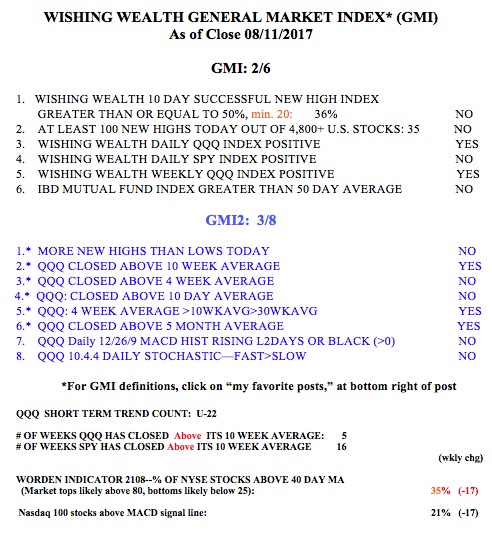
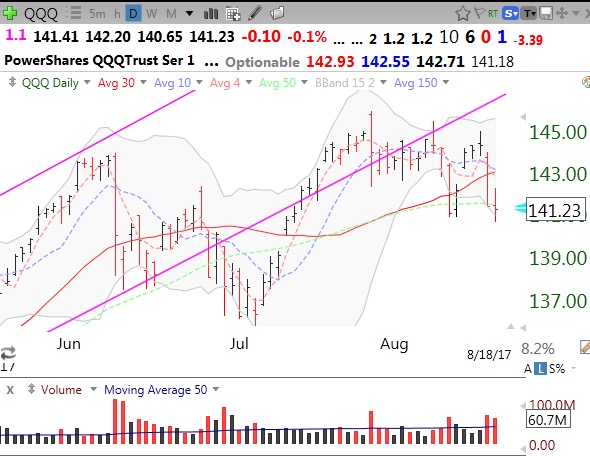
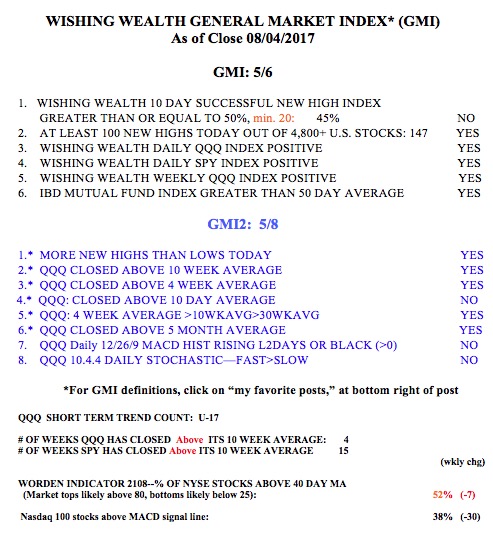
The QQQ short term up-trend held on Friday. However, the GMI has turned Red. I revised Thursday’s GMI to 2, when I discovered that its IBD mutual fund component had turned negative. With Friday’s GMI reading of 2, it triggered a Red signal. In recent years, a GMI of Red has sometimes occurred briefly at the bottom of a decline, so we will have to wait to see what happens this time. When the GMI reads 0, I become very defensive. Furthermore, the put/call ratio was 1.14 on Friday, indicating a significant amount of bearishness among options traders, which usually occurs a day or so before the markets bounce. The QQQ found support on its daily 15.2 lower BB (and 50 day average) on Friday, see daily chart below. If QQQ holds above 140.89, I suspect we will get a decent bounce.
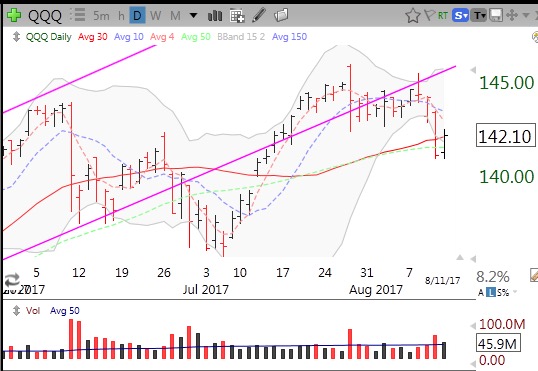
Another stock that bounced last week from its lower BB and 50 day average and may move on to a GLB to an all-time high is MNST. I nibbled at MNST on Friday and placed a sell stop below Friday’s low.
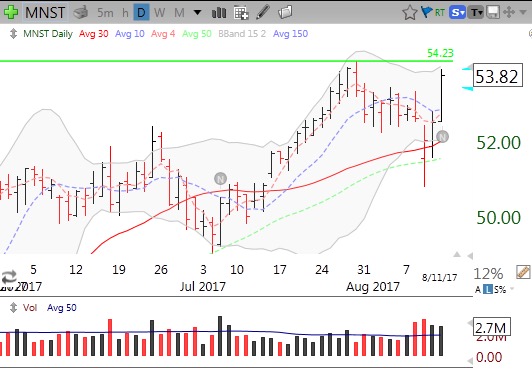
During weak markets, few stocks hit new all-time highs and it is easier to identify possible leaders. As this weekly chart shows, ATHM had a GLB last week on above average volume. ATHM is likely extended now, and I will wait for a good entry, if this market holds.
The GMI registered below 3 for two consecutive days, triggering a change to Red.