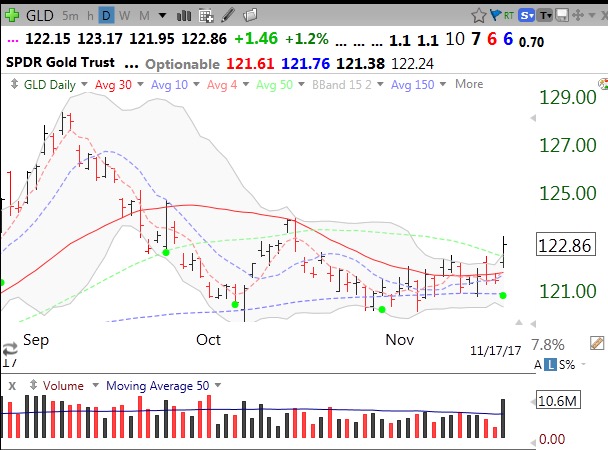
On Friday, GLD appeared to have had an above average volume move up, closing above its 30 and 50 day averages. Green dots show reversals in daily 10.4 stochastics and 3 recent bounces off of a similar area of support. What is strength in gold telling us?
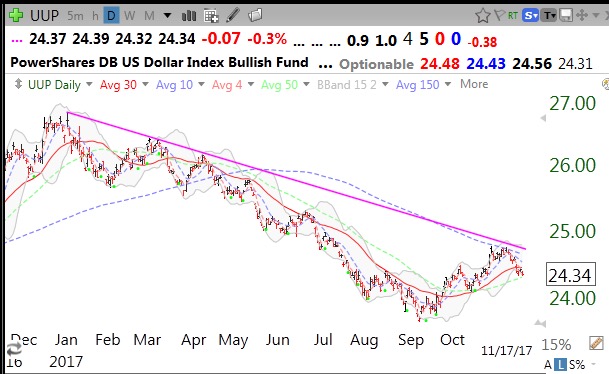
Perhaps the strength in GLD is reflecting resumption of the down-trend in the dollar that began in January. A weak dollar could be an ominous signal for the US economy.
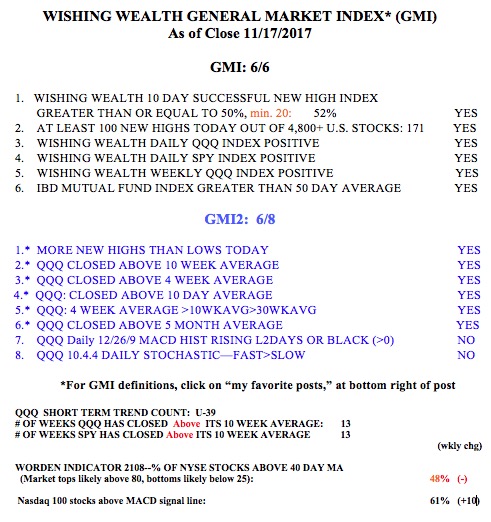
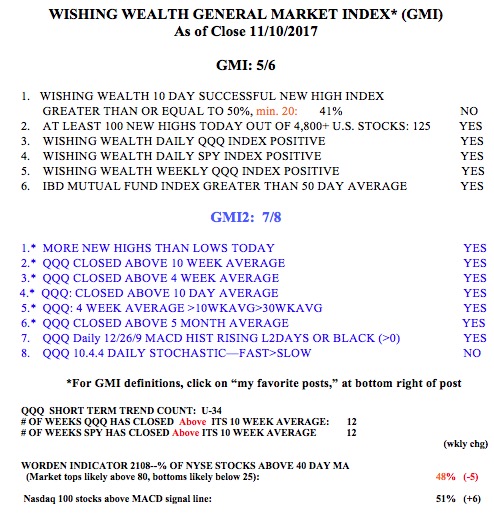
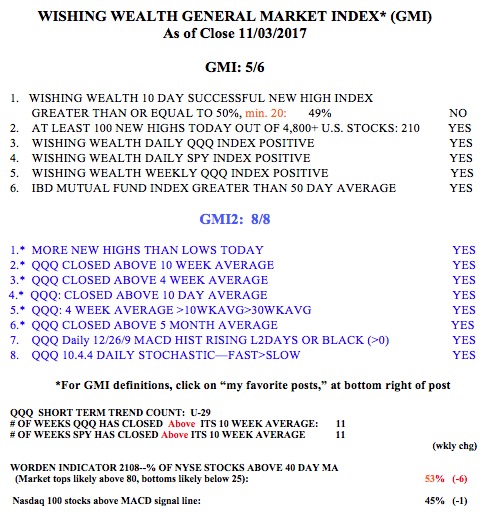
The GMI remains on a Green signal.