This may be the most unique post I have written in a long time. I cannot recall any of the many traders I admire stressing this topic. Over my 50+ years trading I have noticed that I have had more success trading expensive stocks. To understand this idea, we must first dispense with the myth that all that is important in comparing trades is percentage change. I recall that Jesse Livermore, the great trader, once said that he focused on gaining points (dollars) not the percentage he gained or lost on a position. I could not locate Livermore’s exact quote again. The closest quote on this topic I could identify today was one by the great trader and associate of Livermore, Richard Wyckoff:
“If you are trading in 100 share lots, your stock must move your way one point to make $100 profit. Which class of stocks are most likely to move a point? Answer: The higher priced issues. Looking over the records we find that a stock selling around $150 will average 2 1/2 points fluctuations a day, while one selling at 50 will average only one point. Consequently, you have 2 1/2 times more action in the higher priced stock.”
William ONeil has written that it may be a good idea to take profits on a position that has gained 20%. However, a 20% move in a $20 stock is $4, while a 20% gain in a $100 stock is $20. I have found that if I want to make a pilot buy and pyramid or average up into a full position, it is easier for me to do so in a stock that is rising 20 points than one that gains 4 points, even though the percentage moves are identical. I find that the psychological impact of these two trades on me is different.
As an example, if I buy 100 shares of a $300 stock, like BA (cost=$30,000), I can exit with a small loss of two or three points ($300) if the stock immediately moves against me. If I put the same amount of money in a $30 stock (if one focuses on comparing percentage gain, one has to put the same amount of money in each of the positions being compared), I would be buying 1,000 shares of the $30 stock ($30,000) and losing $1000 for every point that it fell. In reality, I would typically buy only 100 shares of the cheaper stock, thereby reducing my possible risk and profits, at least initially to $100 per point. I am therefore more comfortable managing the trade for an expensive stock.
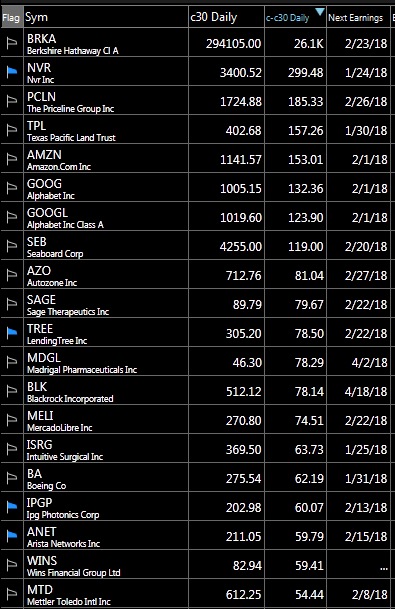
So does Wyckoff’s observation that expensive stocks gain more points still hold today? Here is a list of the top 20 gainers the past 30 trading days among 4865 US stocks in TC2000. The column C30 shows the closing price of each stock 30 days ago and the next column (C-C30) shows the total dollars gained by the stock last Friday since 30 days before. All of these stocks gained more than $54 in the past 30 days. It is clear that 85% (17/20) of these large point gainers were priced at $100 or more 30 days ago, before this gain occurred. The 3 exceptions were less but not cheap: SAGE (89.79), MDGL (46.30) and WINS (82.94). The third column shows the expected next earnings date, an important piece of information for me to always be aware of. No matter when I have repeated this analysis the findings tell the same story. In fact, 95% of the next 20 top gainers the last 30 days (not shown) were over $100, 30 days ago. The same relationship occurs for ETFs.
My conclusions:
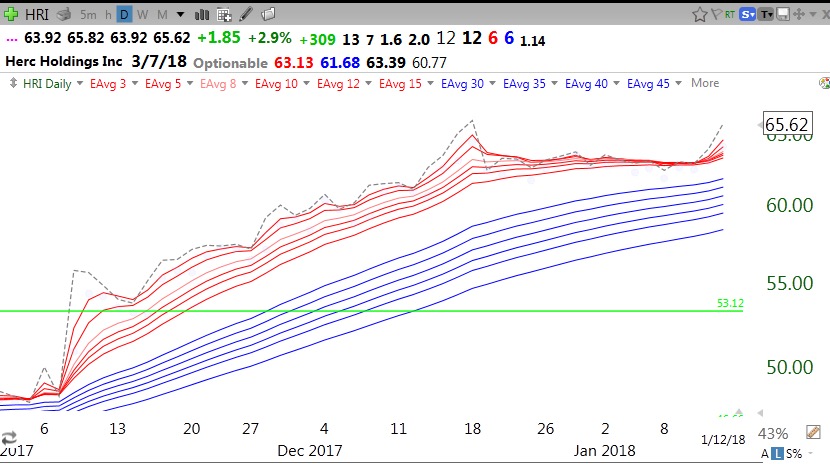
If I plan to buy a stock or options, I will have a better chance of having a large dollar gain if I focus on stocks that meet my purchase set-up criteria and are expensive, at least $100 or more. I love to use this strategy with call options, which usually cover 100 shares, because if my timing is correct, the stock and the option could gain many points.
There are a number of reasons why I like expensive stocks:
- They are trading over $100 probably because big money/institutions bid them up;
- They are probably harder (more expensive) to manipulate/whipsaw than cheap stocks;
- I have time to accumulate a posiiton in stages as it rises;
- There is a smaller universe of stocks over $100 to monitor;
- I typically can make more money when I am right;
All of the above, of course, assumes that I have excellent rules for quickly exiting a losing position, because high priced stocks can drop many points more quickly. By the way, this strategy is antithetical to most inexperienced traders’ dreams of buying cheap stocks that will rocket to the moon…..
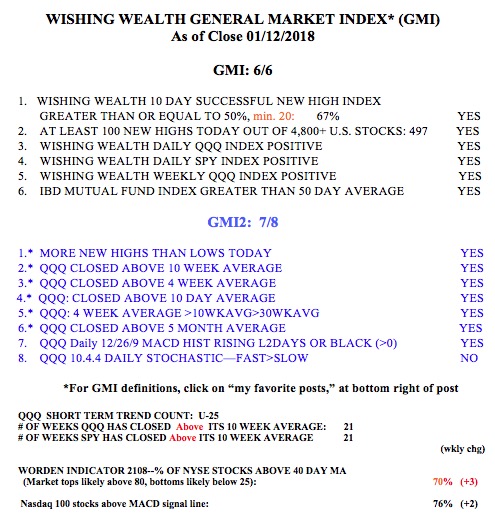
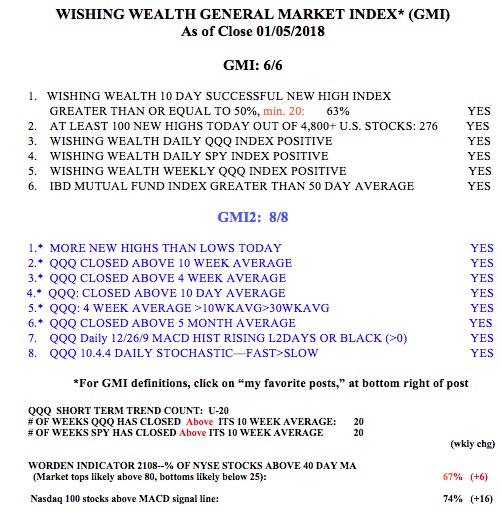
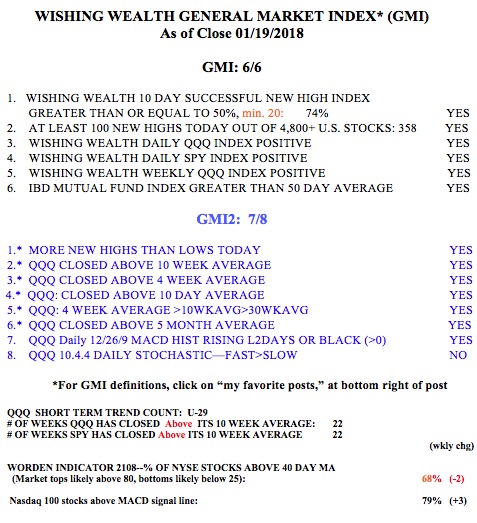
The GMI remains at 6 (of 6).
My honors seminar on technical analysis for undergraduates begins this week. I am looking forward to sharing all of these ideas with a new class of brilliant students.